Internet website http://www.foundationwebsite.org, updated 22 November 2020. Books and articles on Planetary Management and other topics from Tucson, Arizona. Copyright © 1999-2020 Joseph George Caldwell. All rights reserved.
The following are lecture notes for a number of short courses on statistical methods useful for monitoring and evaluation of projects and programs. They cover a variety of topics, including sample survey design and analysis for descriptive and analytical surveys; causal inference for impact evaluation and policy analysis; time-series analysis for forecasting and control; multivariate analysis; demography; sample size estimation, and small-area estimation. The sample-size estimation material includes estimation of sample sizes for descriptive surveys based on precision analysis and estimation of sample sizes for analytical surveys based on statistical power analysis.
Note on formatting. The statistics courses were originally presented in .pdf file format, since early versions of HTML could not display mathematical expressions (equations, formulas, special symbols) well. With the advent of mobile devices, that format became problematic. The files downloaded very slowly and generated the search engine optimization (SEO) error "not mobile-friendly." In response to this issue, the .pdf versions of the courses were removed from the website, leaving only the .htm versions. Unfortunately, the mathematical expressions are not always rendered well in HTML. Moreover, since every formula and every single special symbol is stored in a separate image file, load times may be slow. Since the font size for the courses is less than 16, SEO engines generate the error (on mobile devices) "text too small" and "clickable elements too close together" (as well as "not mobile friendly").
(The following documents are notes intended to accompany lectures. Some of the documents contain many figures, others do not. Updated 4 August 2020)
Day 3: Review of Statistical Inference (review of theory needed as background for other topics).
Days 4 and 5: Causal Inference and Matching.
Sample Survey Design for Impact Evaluation (One-Page Summary).
Sample Survey Design for Evaluation (article, not lecture notes).
Day 10: Small Area Estimation.
Day 11: Continuous Multivariate Analysis.
Briefing on univariate time series analysis.
A version of the TIMES Box-Jenkins Forecasting System Technical Reference Manual.
Examples of Reports on Impact Evaluation
The goal of causal inference is to estimate causal effects, or the magnitude of changes resulting in one variable (an effect variable, or output variable) when changes are made in another variable (a causal variable, or input variable), over a population of interest. In a laboratory setting, estimation of causal effects can be based on a designed experiment, where experimental units are randomly selected from the population of interest, experimental conditions (experimental conditions, levels of treatment variables) are randomly assigned to the selected experimental units, and causal effects are estimated from the experimental data. For estimation of program impact for social and economic programs, it may not be possible or feasible to implement the controlled randomization required by a designed experiment. In such cases, it is necessary to take into account how experimental units are selected, and how treatment levels are assigned to them. If the probability of selection is nonzero for all members of the population and can be estimated, then it is possible to obtain sound (unbiased, consistent) estimates of causal effects. Alternative approaches are available for doing this. Some approaches focus on variables that affect selection; some approaches focus on variables that affect outcome; and some approaches focus on variables that affect both selection and outcome. The following reports illustrate several of these approaches.
2. Final Report (Revised), Impact Evaluation of the Transportation Project in Honduras, NORC at the University of Chicago (Chicago, IL and Bethesda, MD), Millennium Challenge Corporation, Washington, DC, December 20, 2013. Addendum
Here follow a number of items that provide summary descriptions of a number of topics. These items were used, for example, as the basis for technical sections of proposals.
Vista's Approach to Evaluation. Proposal input. (11 September 2006)
Vista's Approach to Sample Survey Design. Proposal input. (11 September 2006)
Approach to Management Information System Design. Proposal input. (31January 2007)
Sample Survey Design for Impact Evaluation (One-Page Summary). (25 January 2018)
Database Design for Monitoring and Evaluation (Two-Page Summary). (26 January 2018)
Receiver Operating Characteristic Graph. Informal briefing (in Microsoft PowerPoint). (27 February 2007)
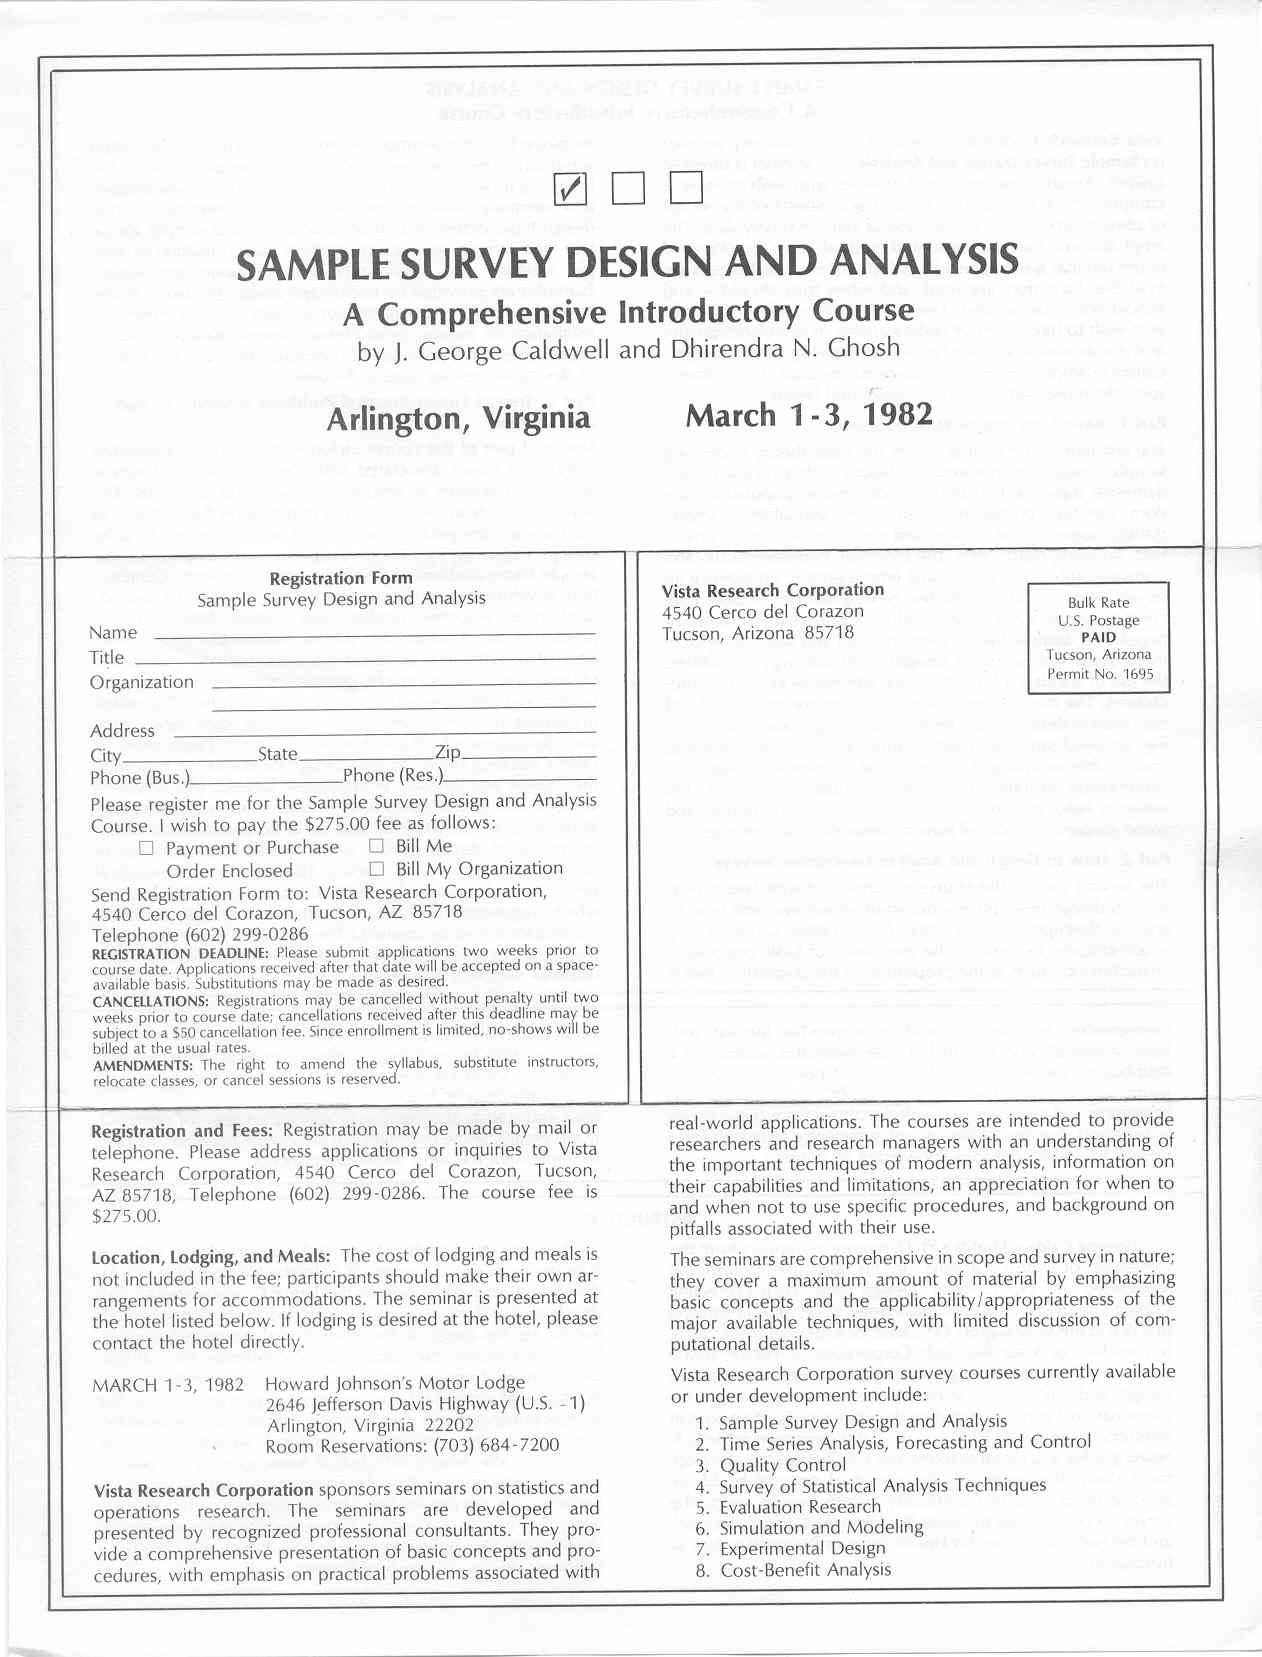
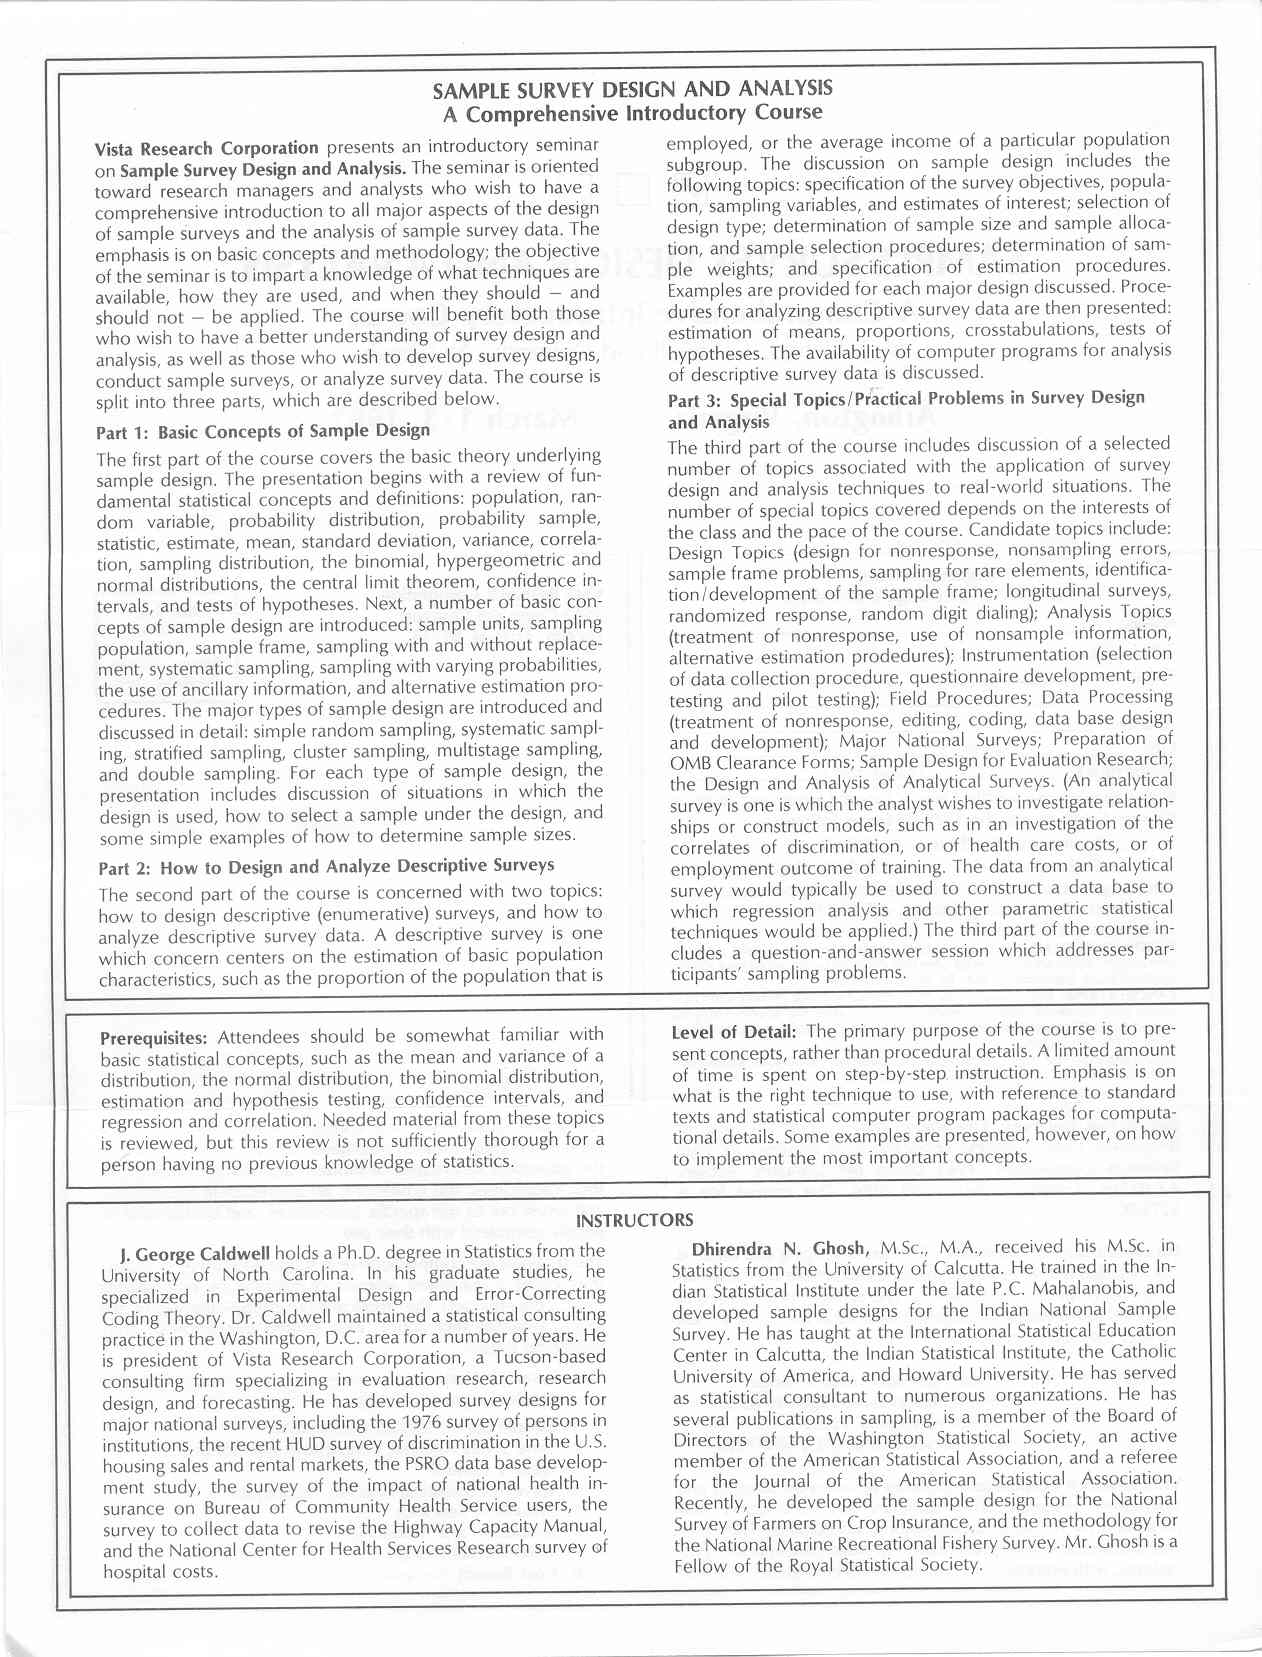
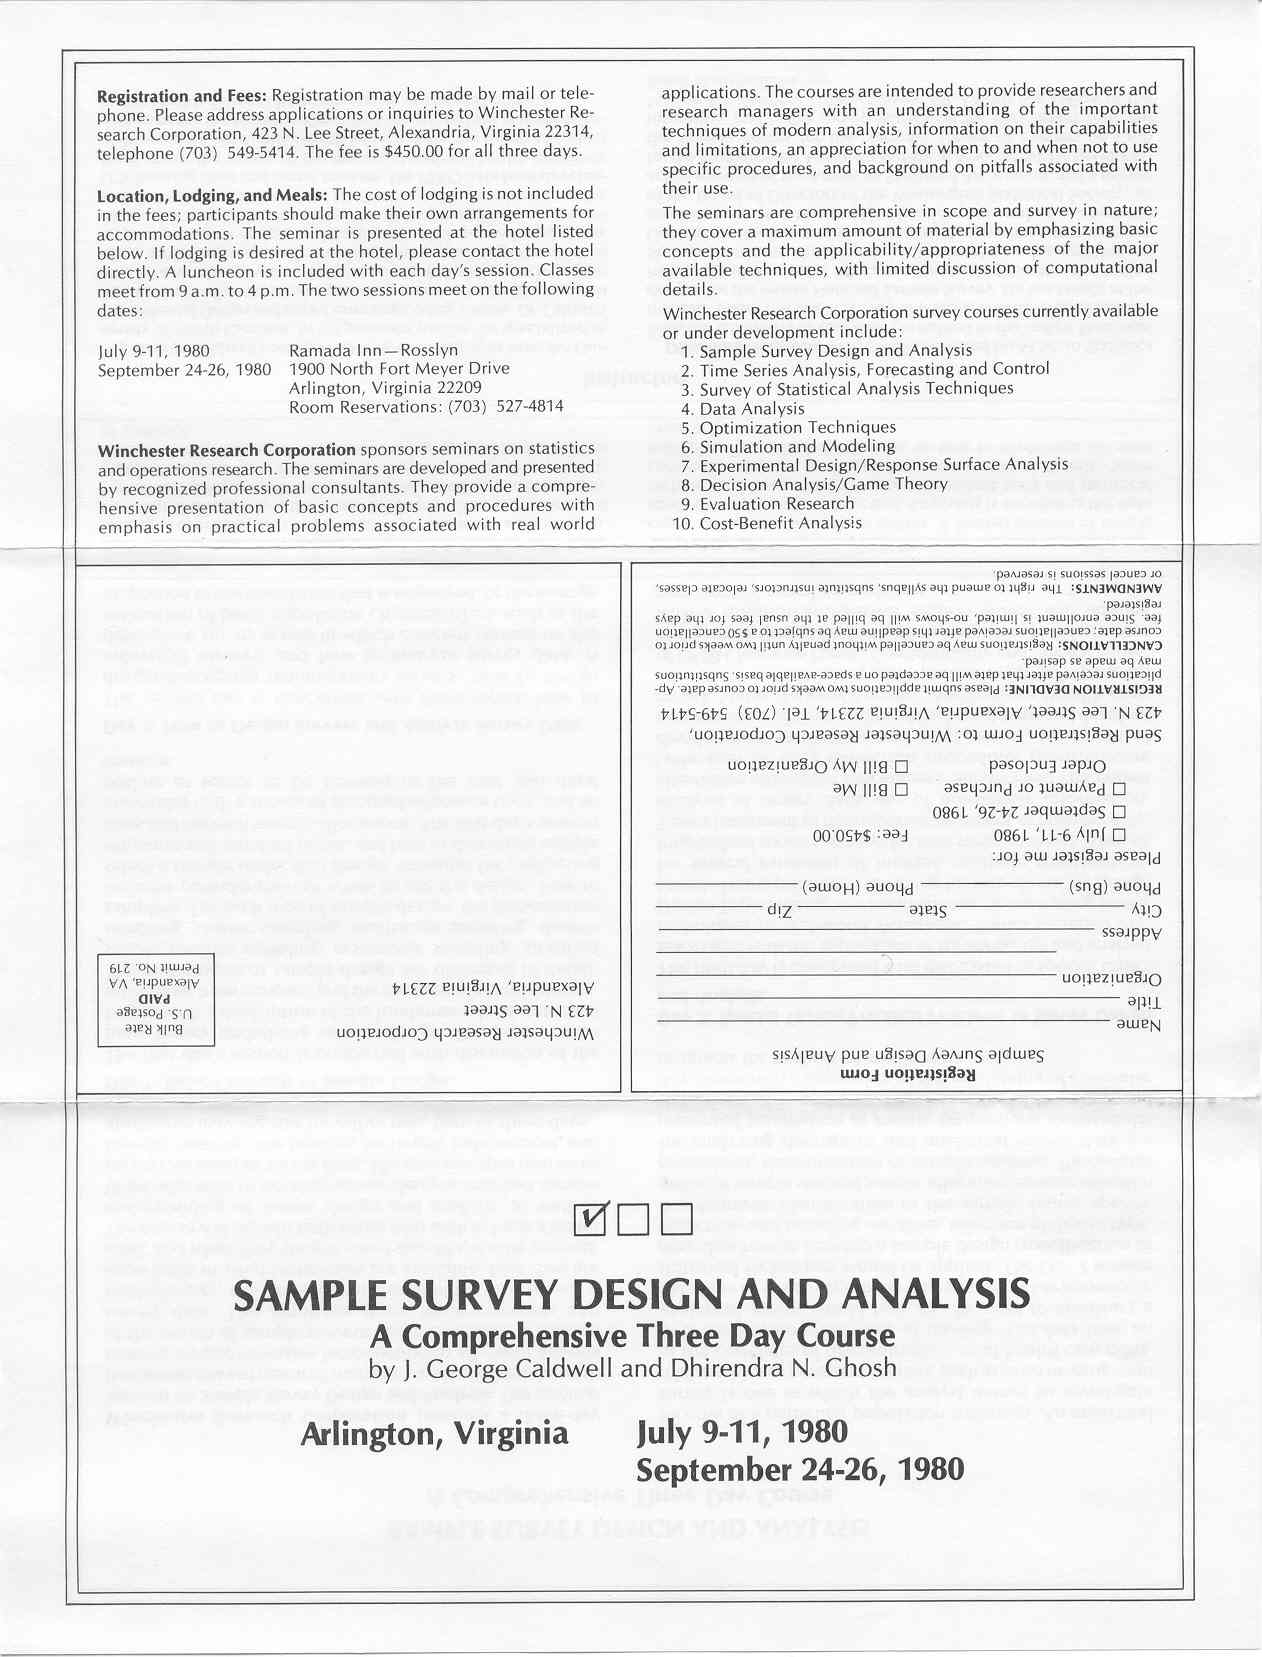
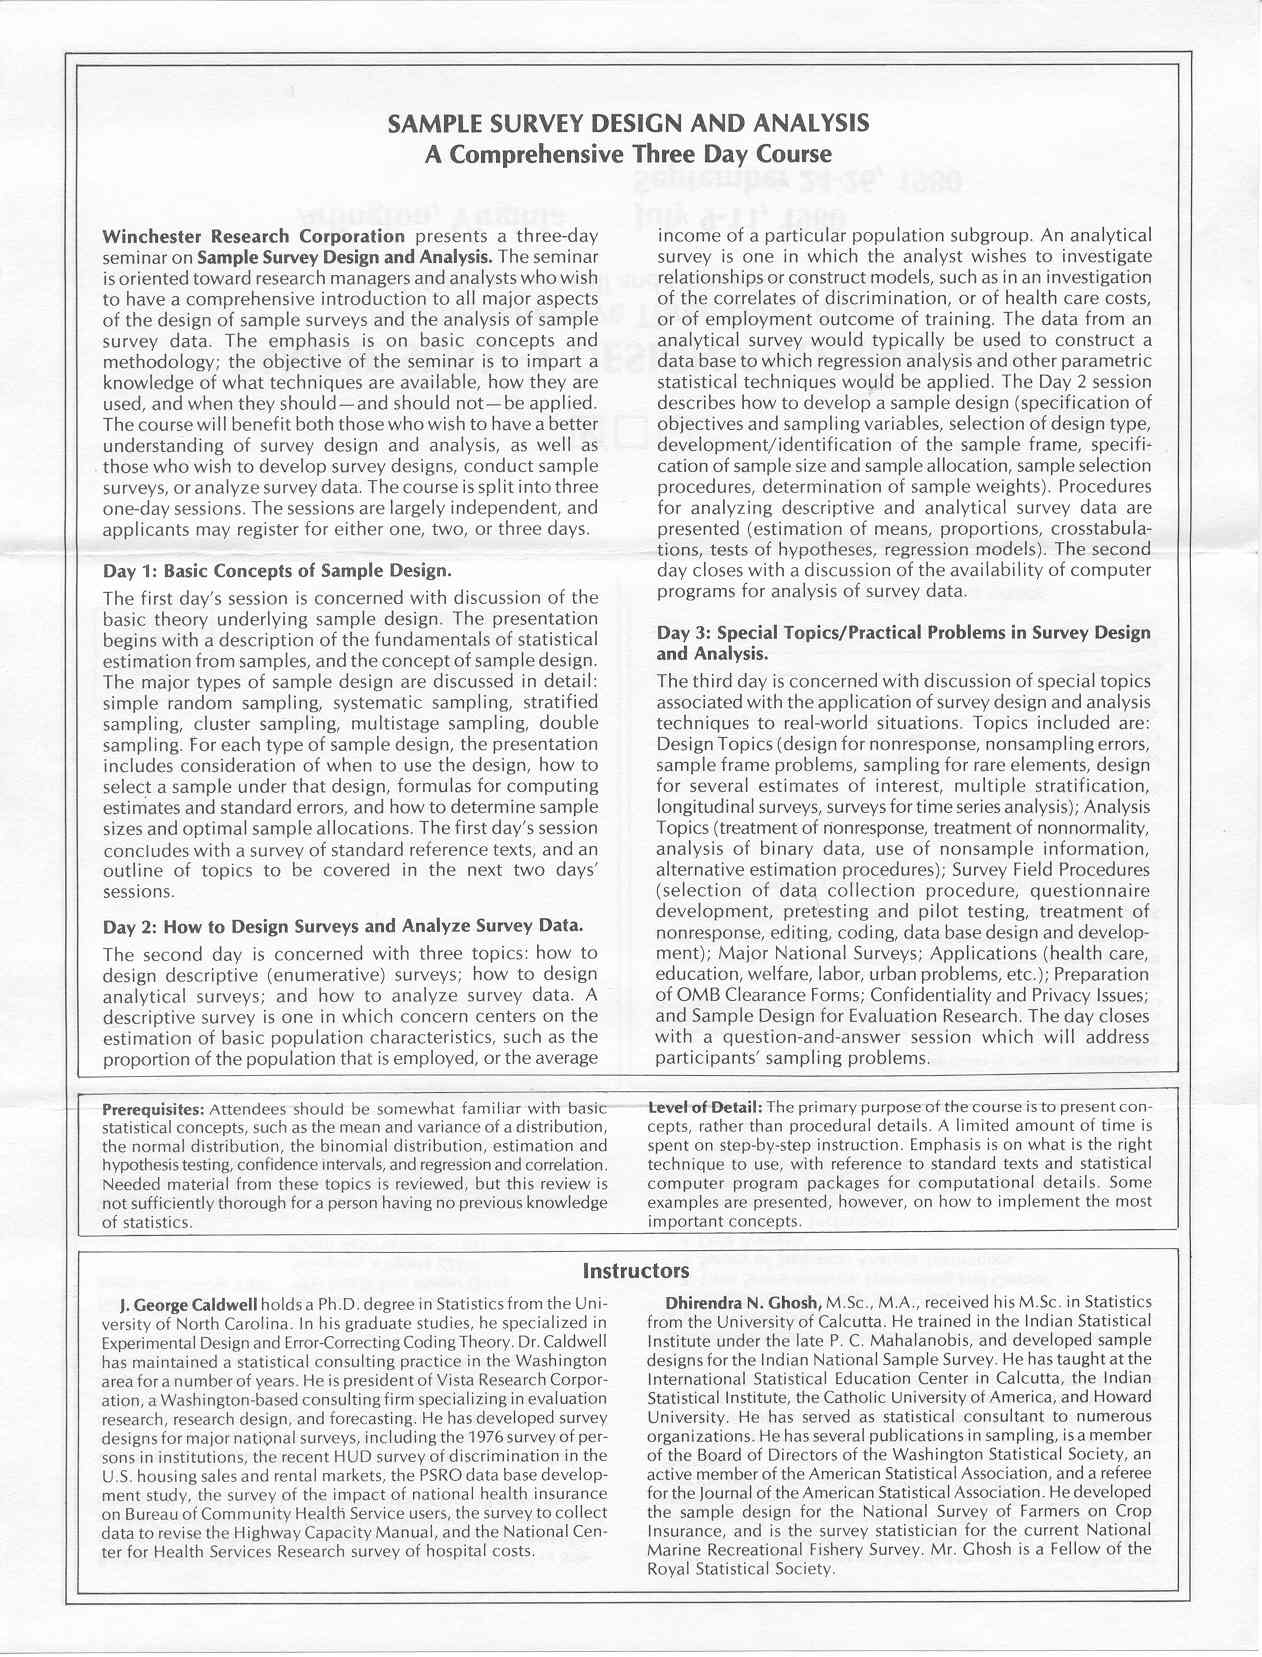
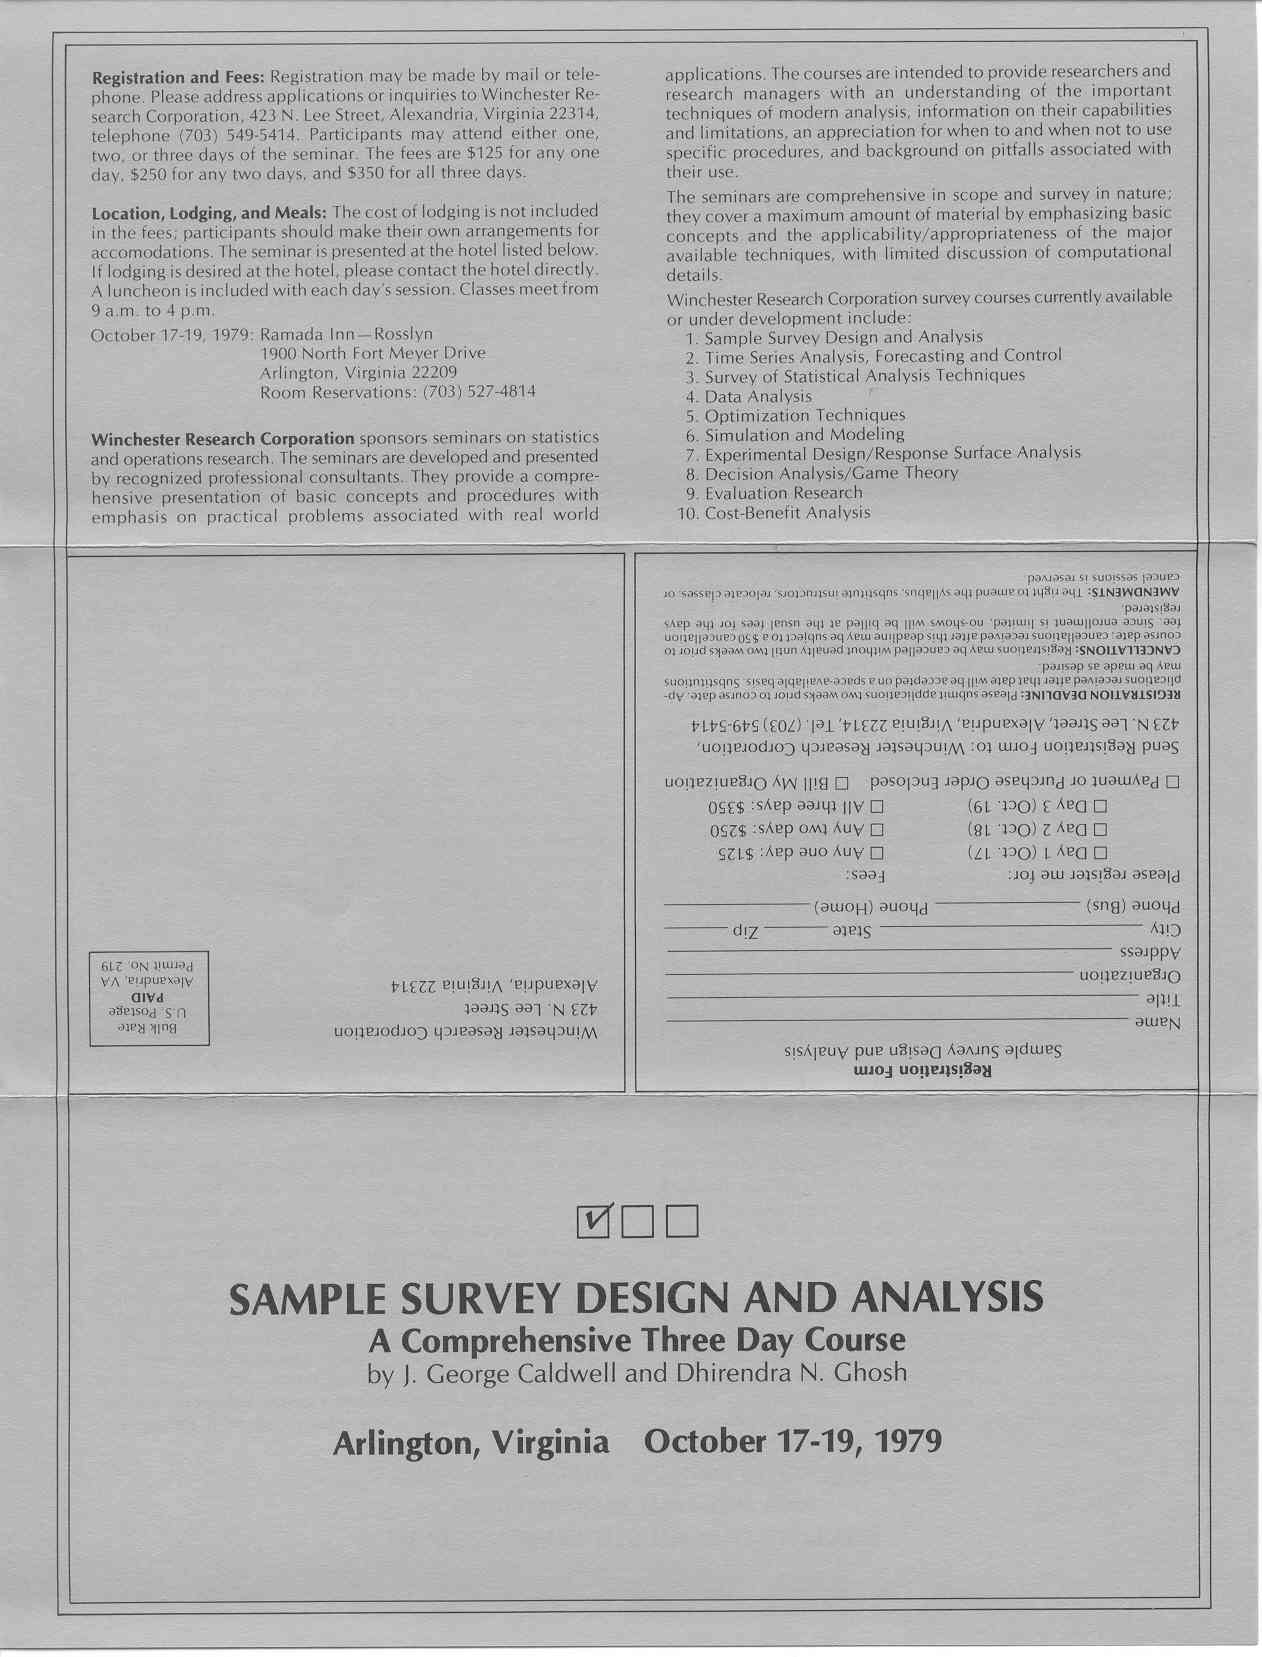
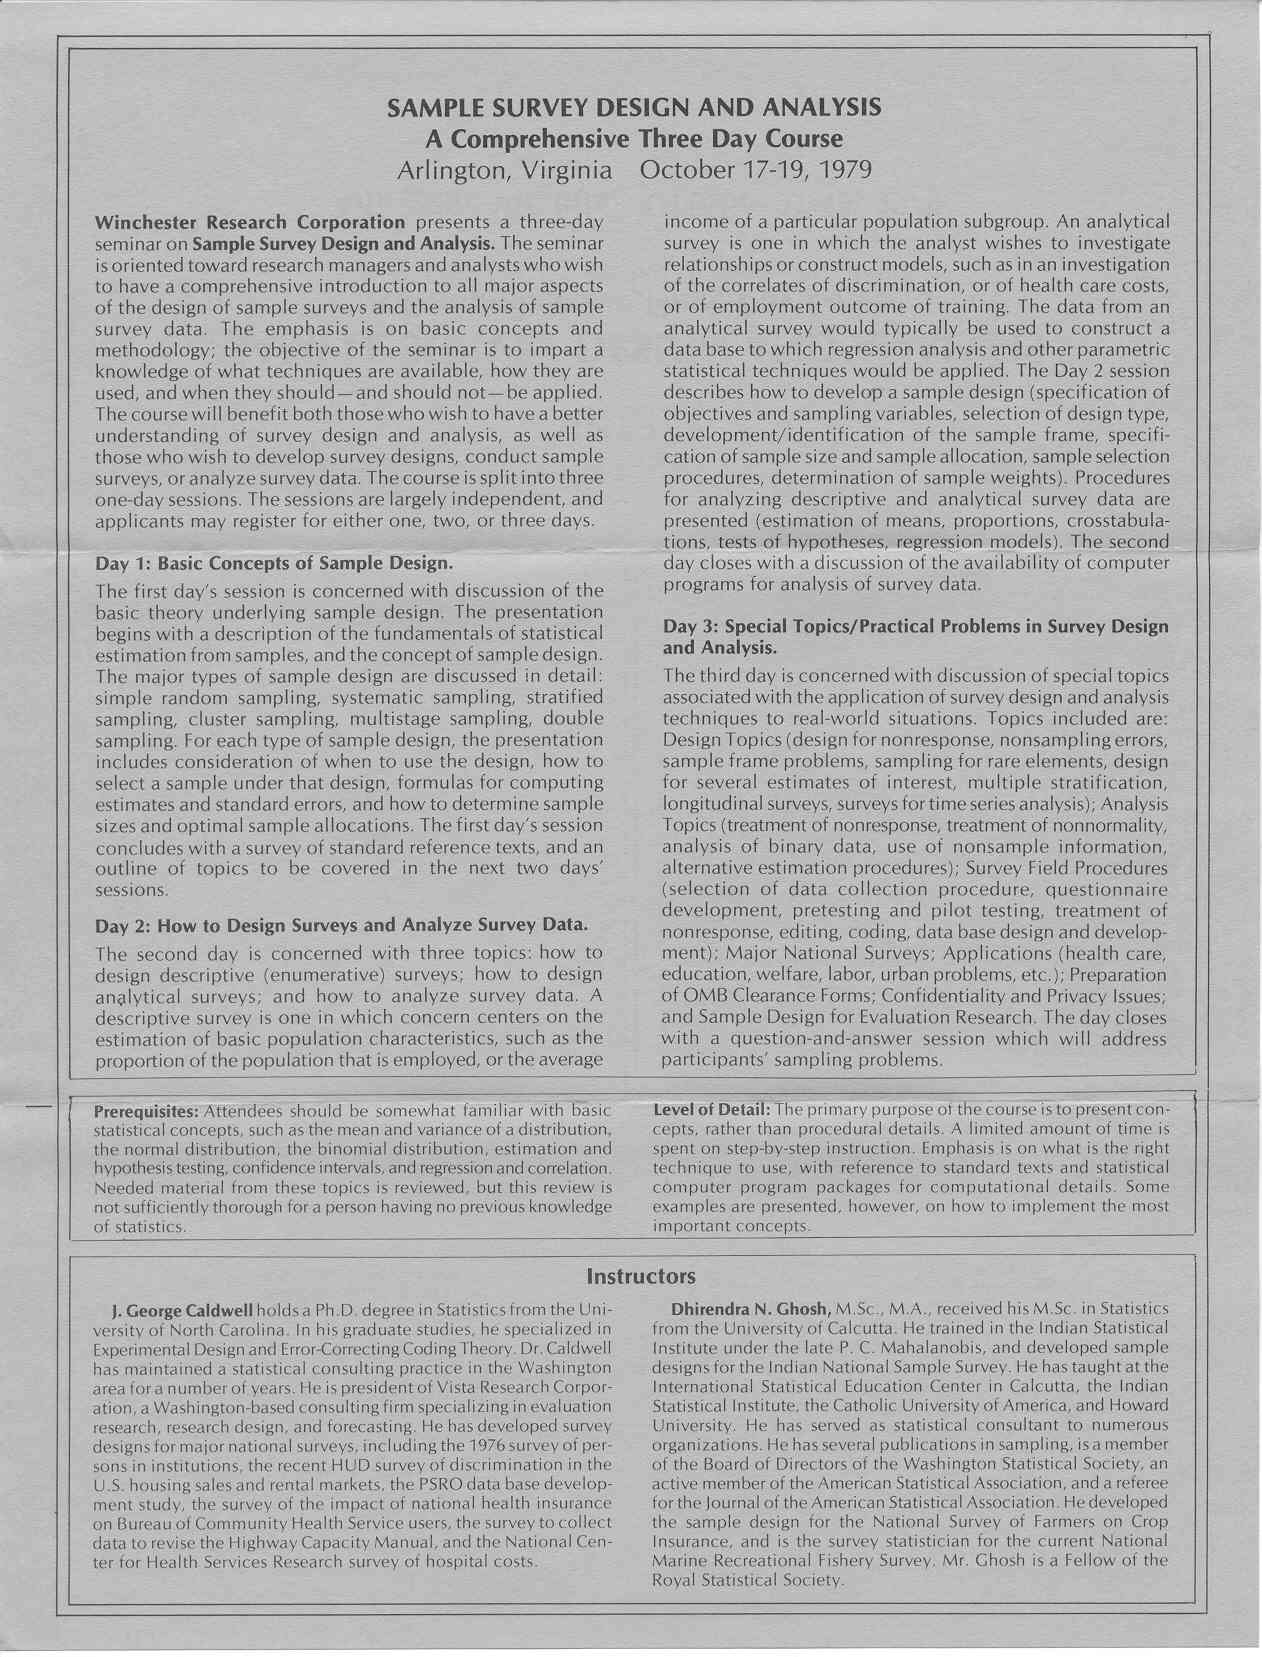
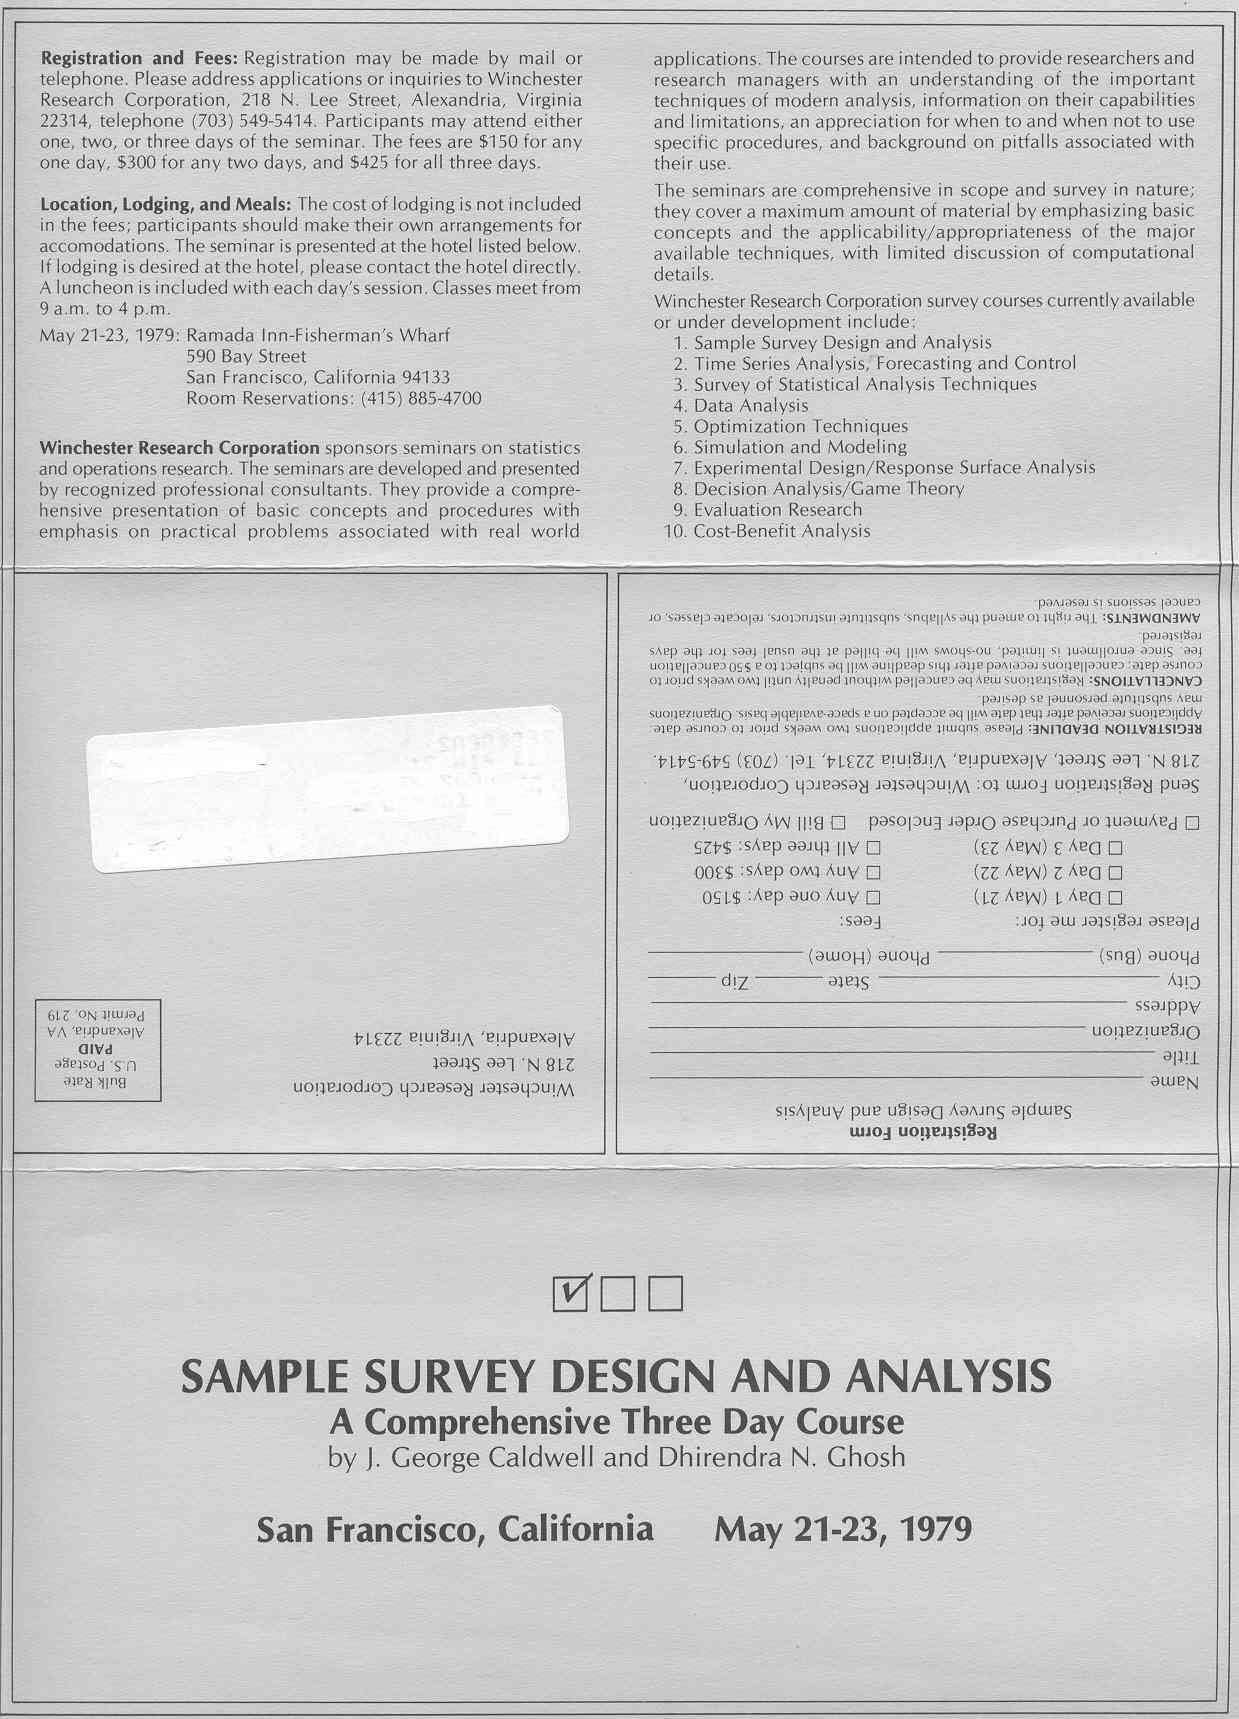
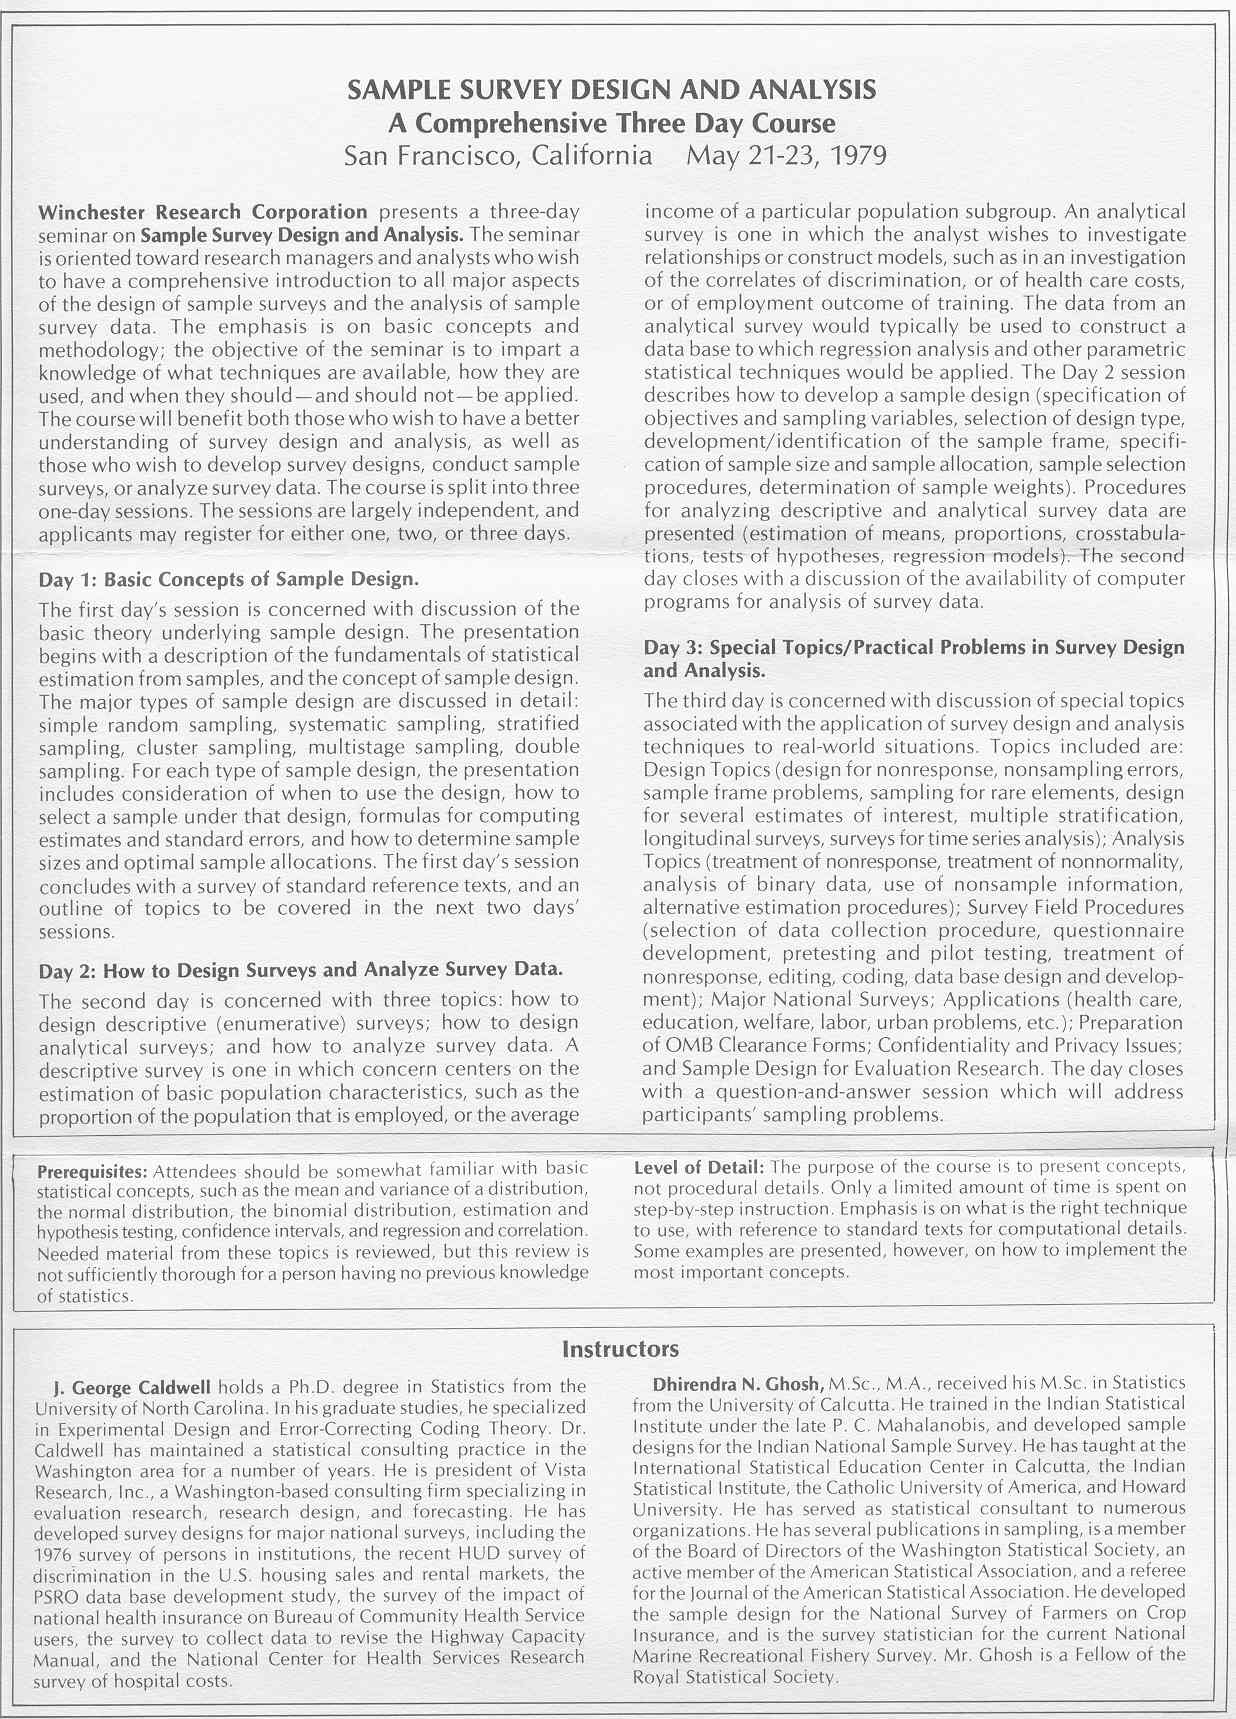
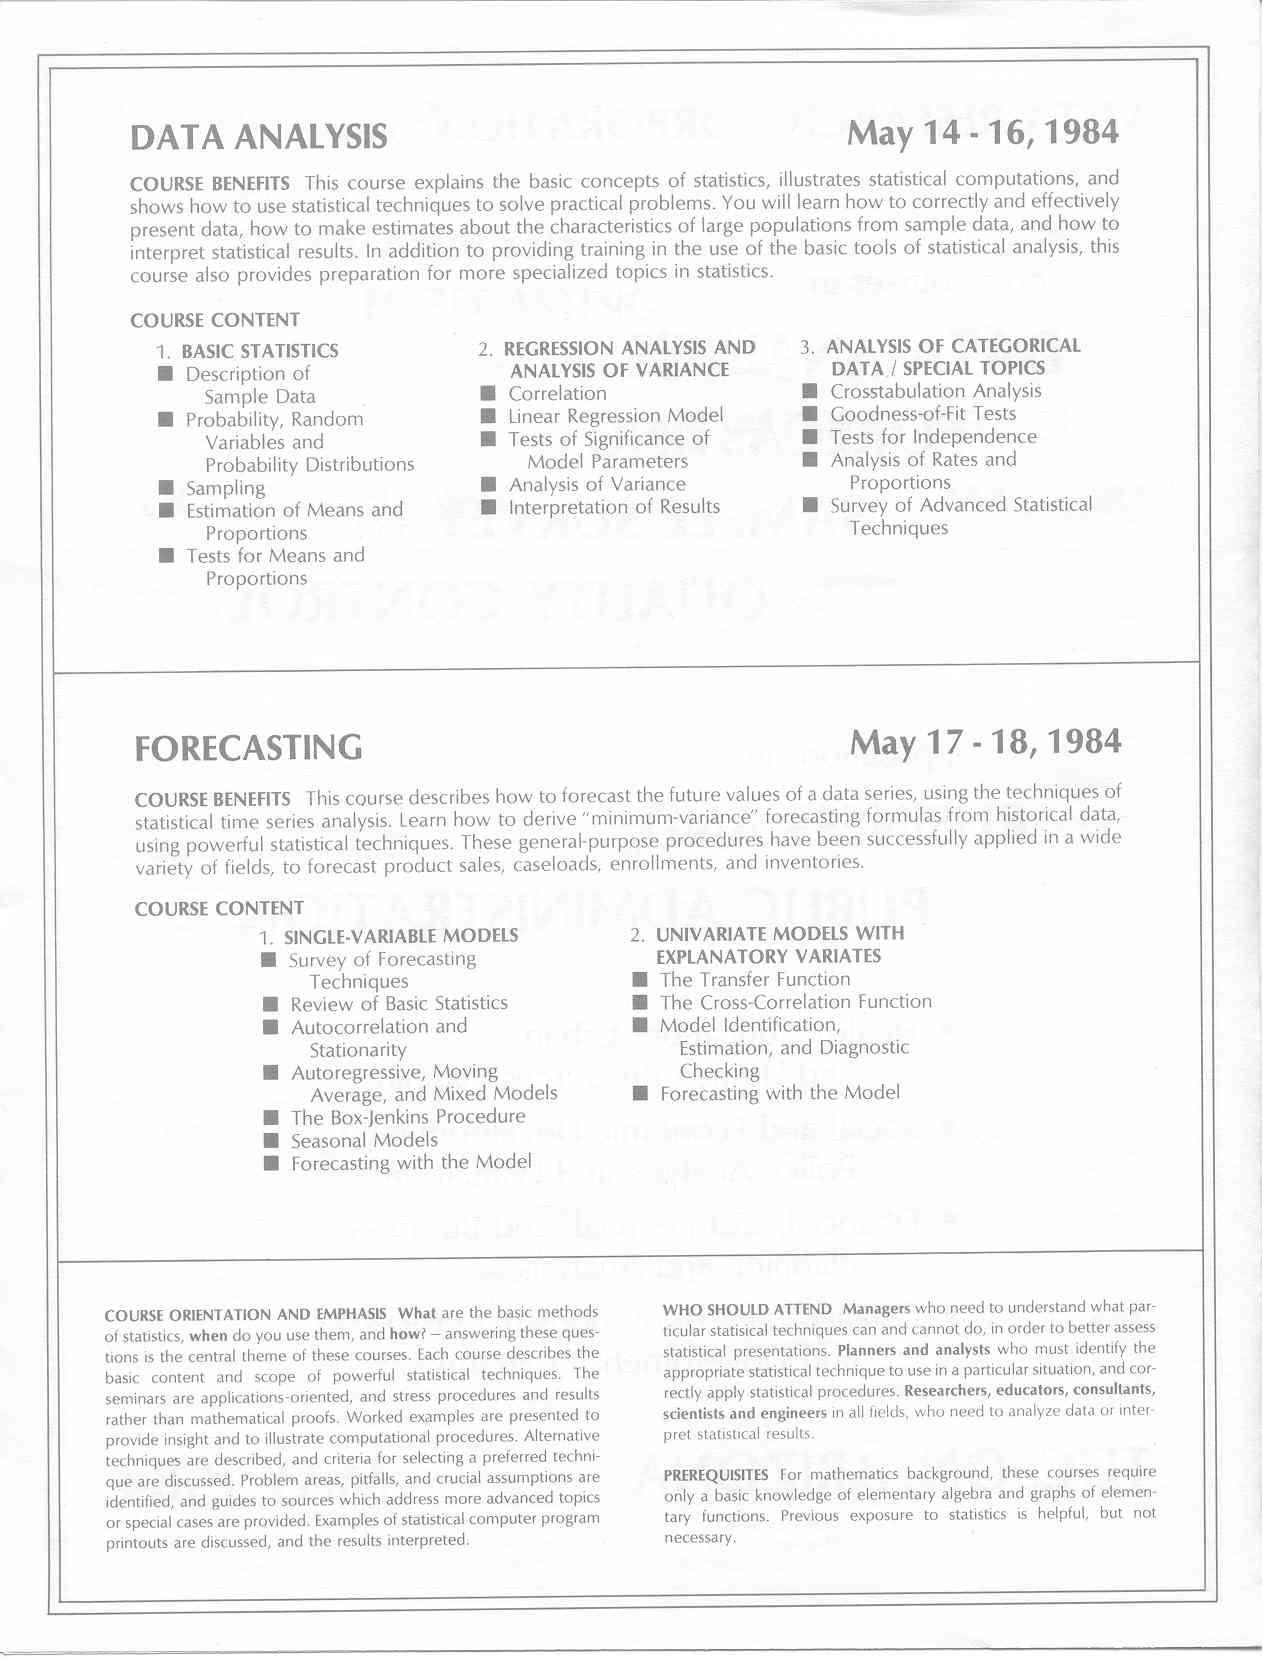
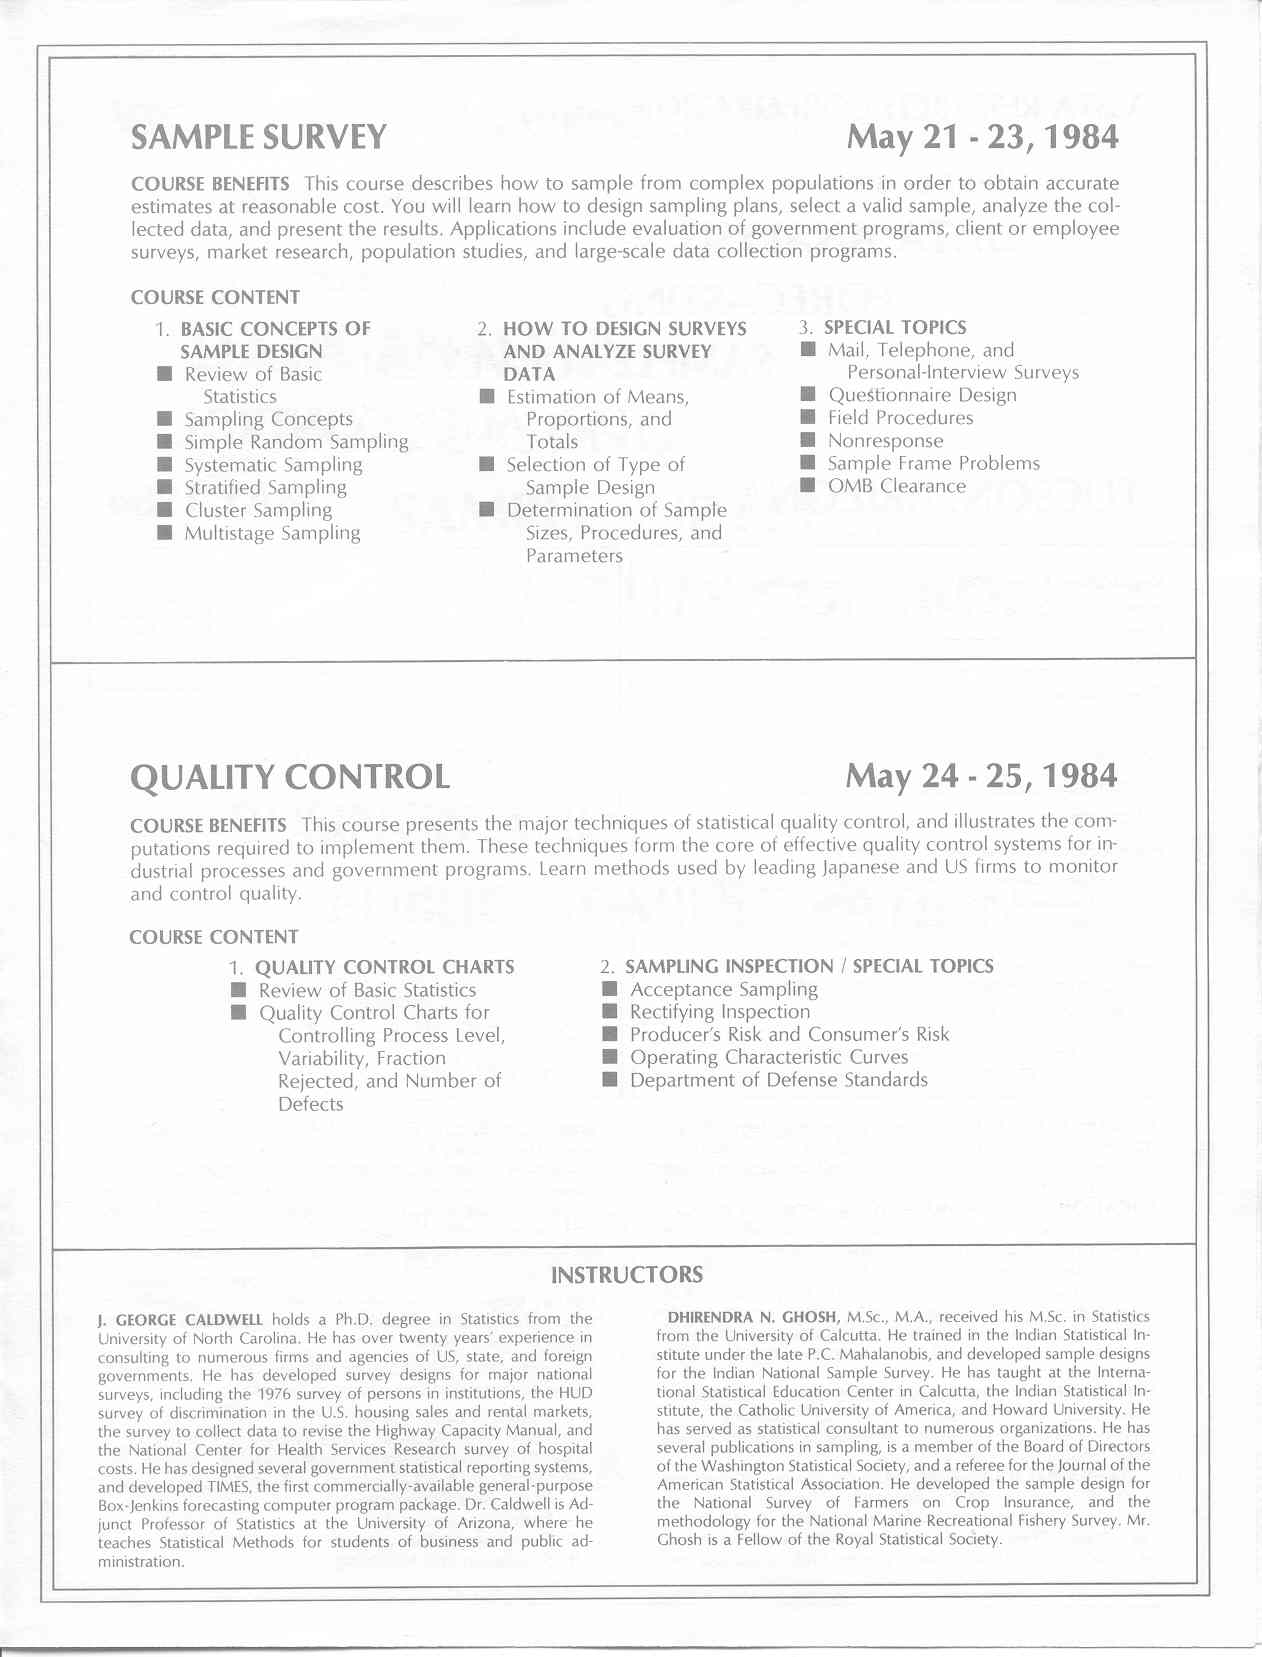
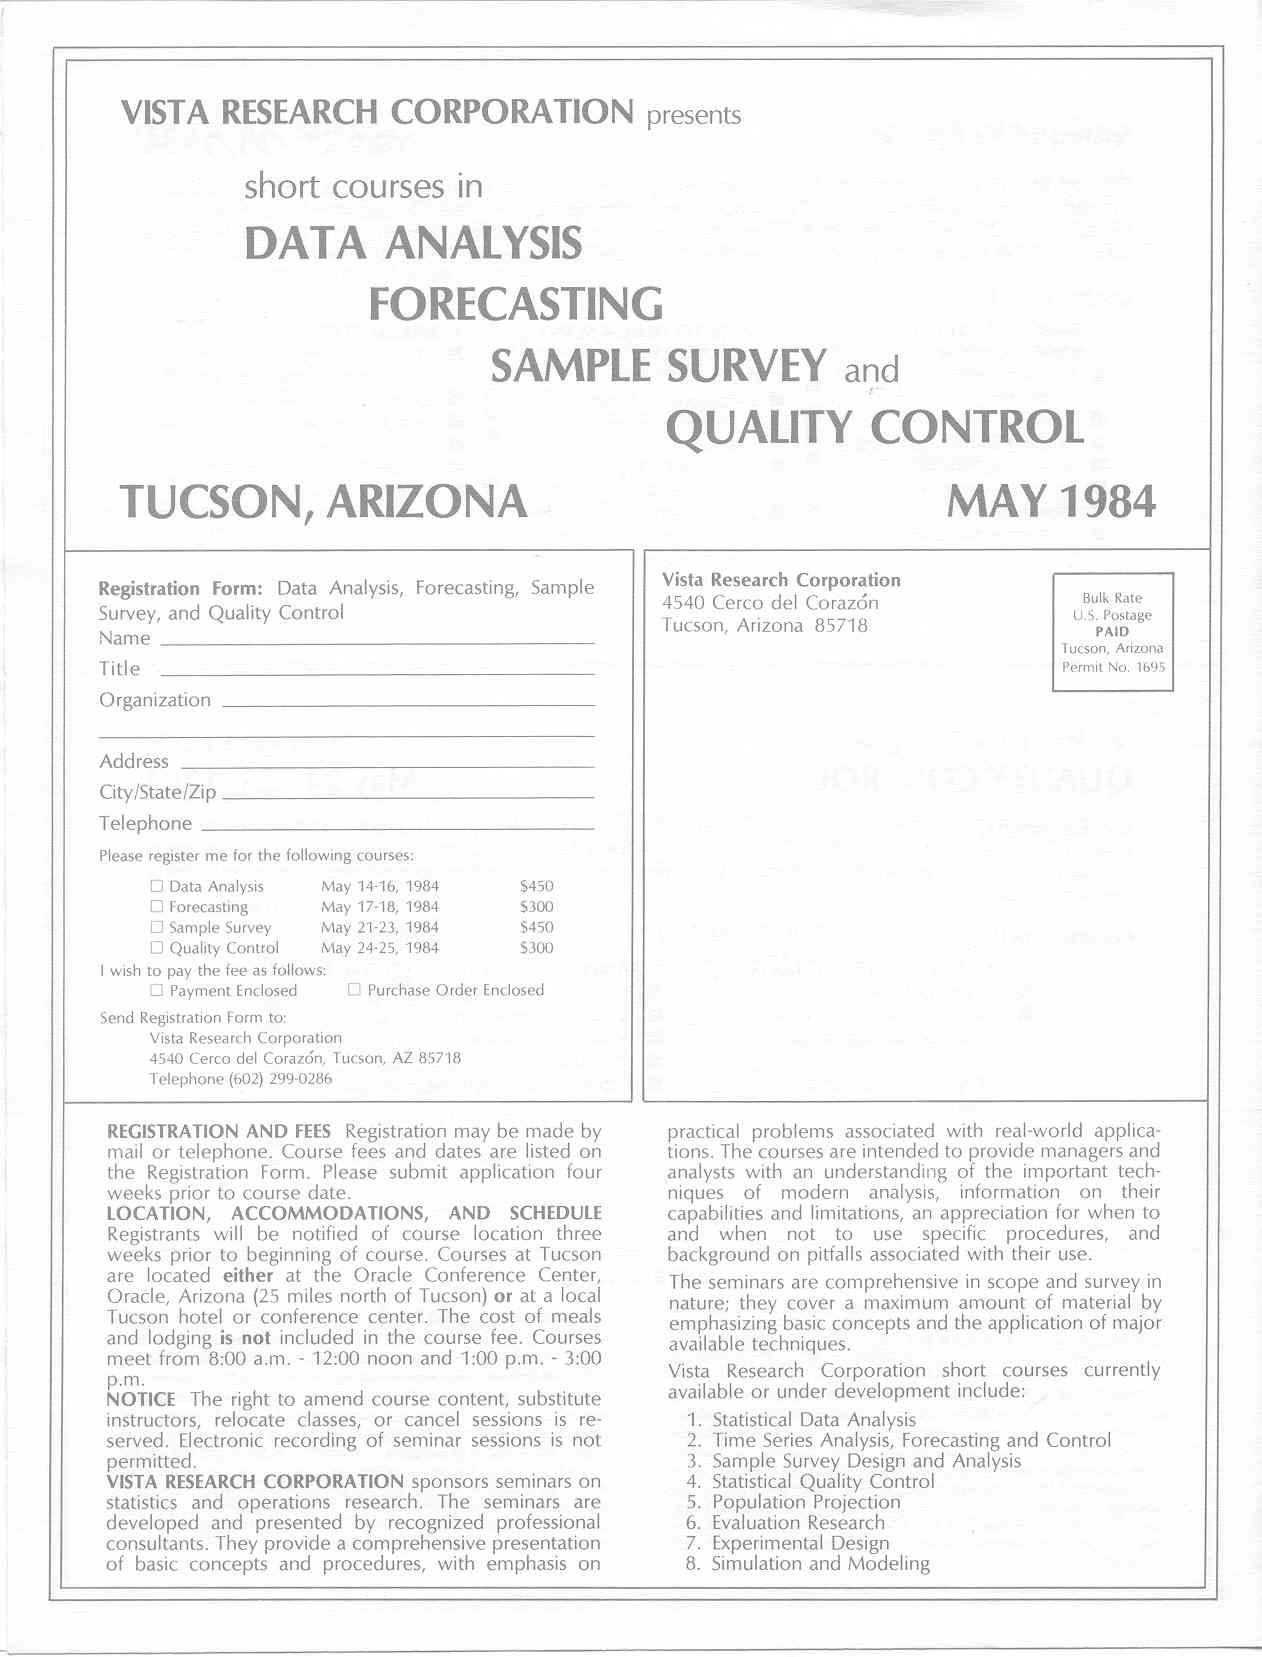
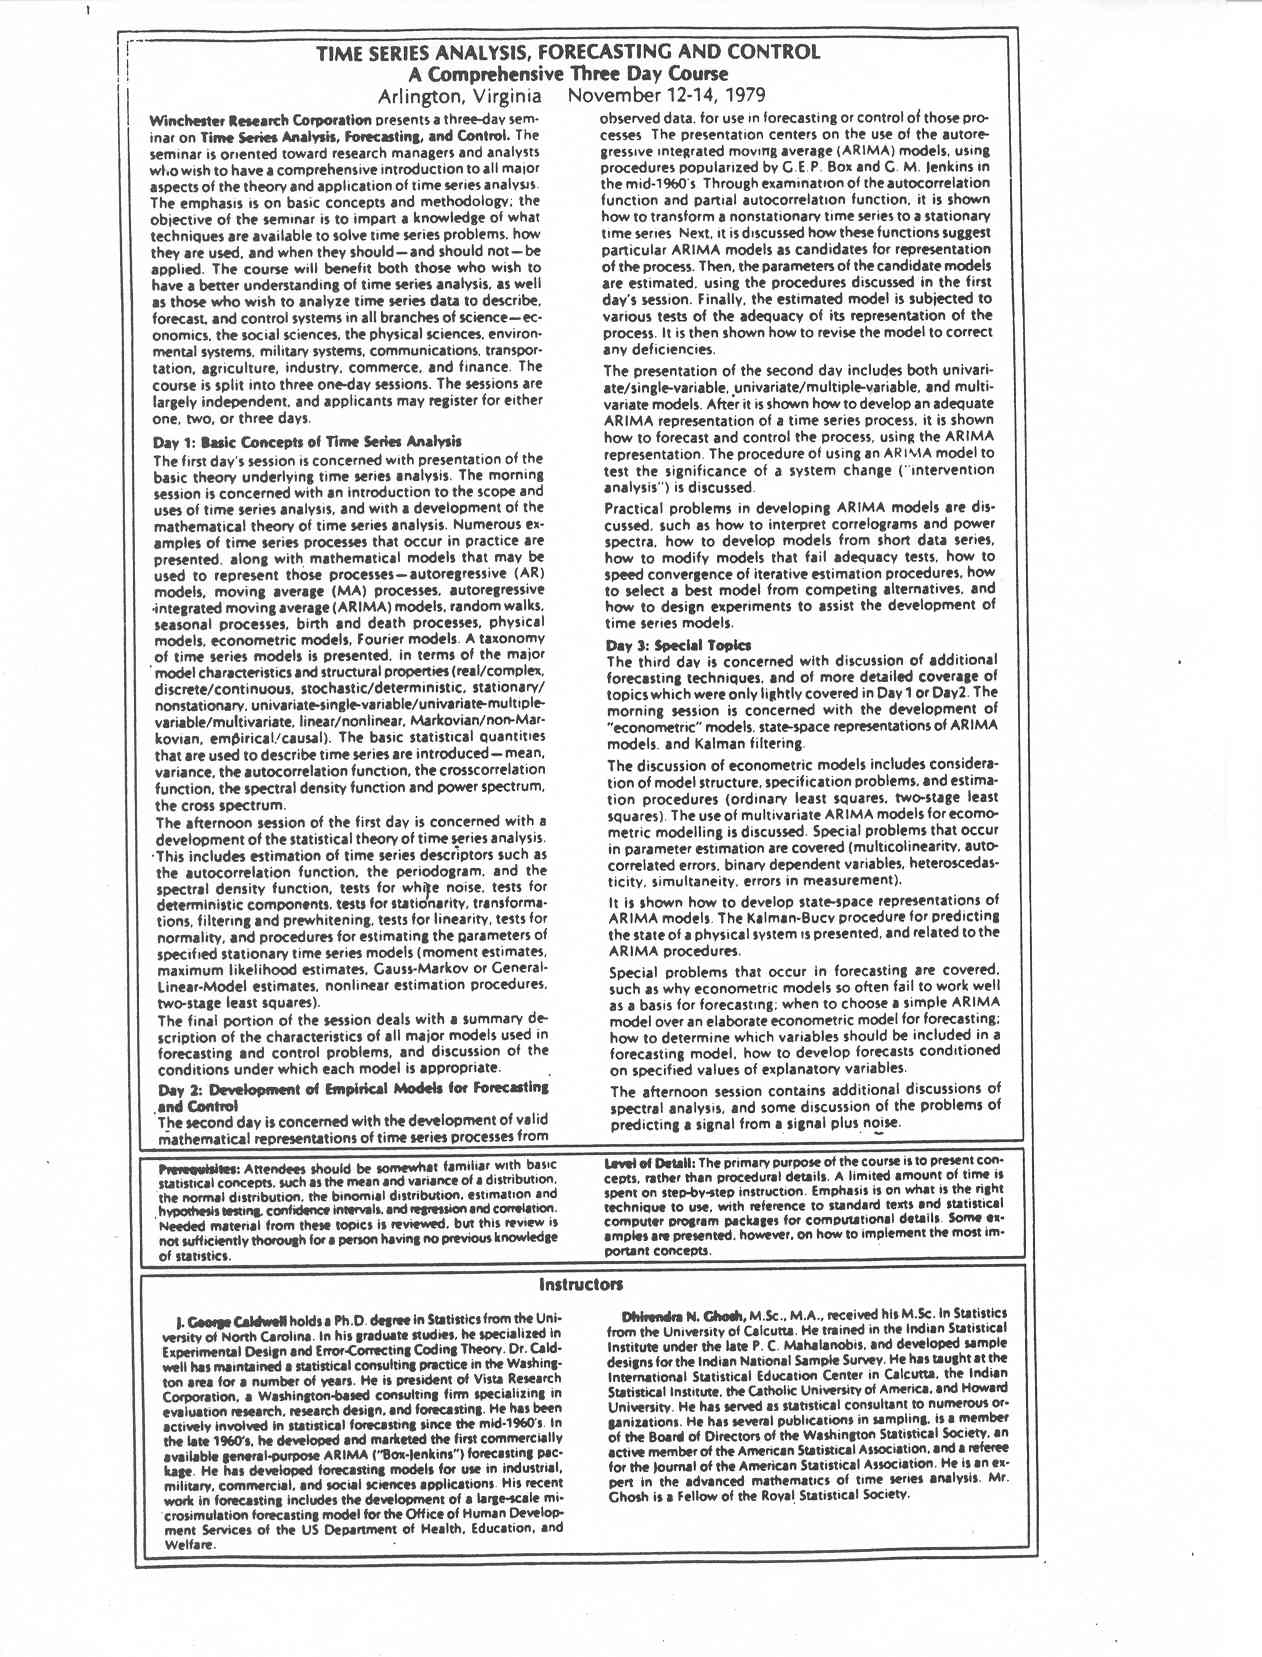
Course Flyers. Here follow mailing flyers used for a number of commercial short courses on sample survey design and analysis. Some of the courses were given, some were not. (3 April 2007.)
SampleSurvey1 SampleSurvey2 SampSurvArl1 SampSurvArl2 SampSurvArling1 SampSurvArling2 SampSurvSF1 SampSurvSF2
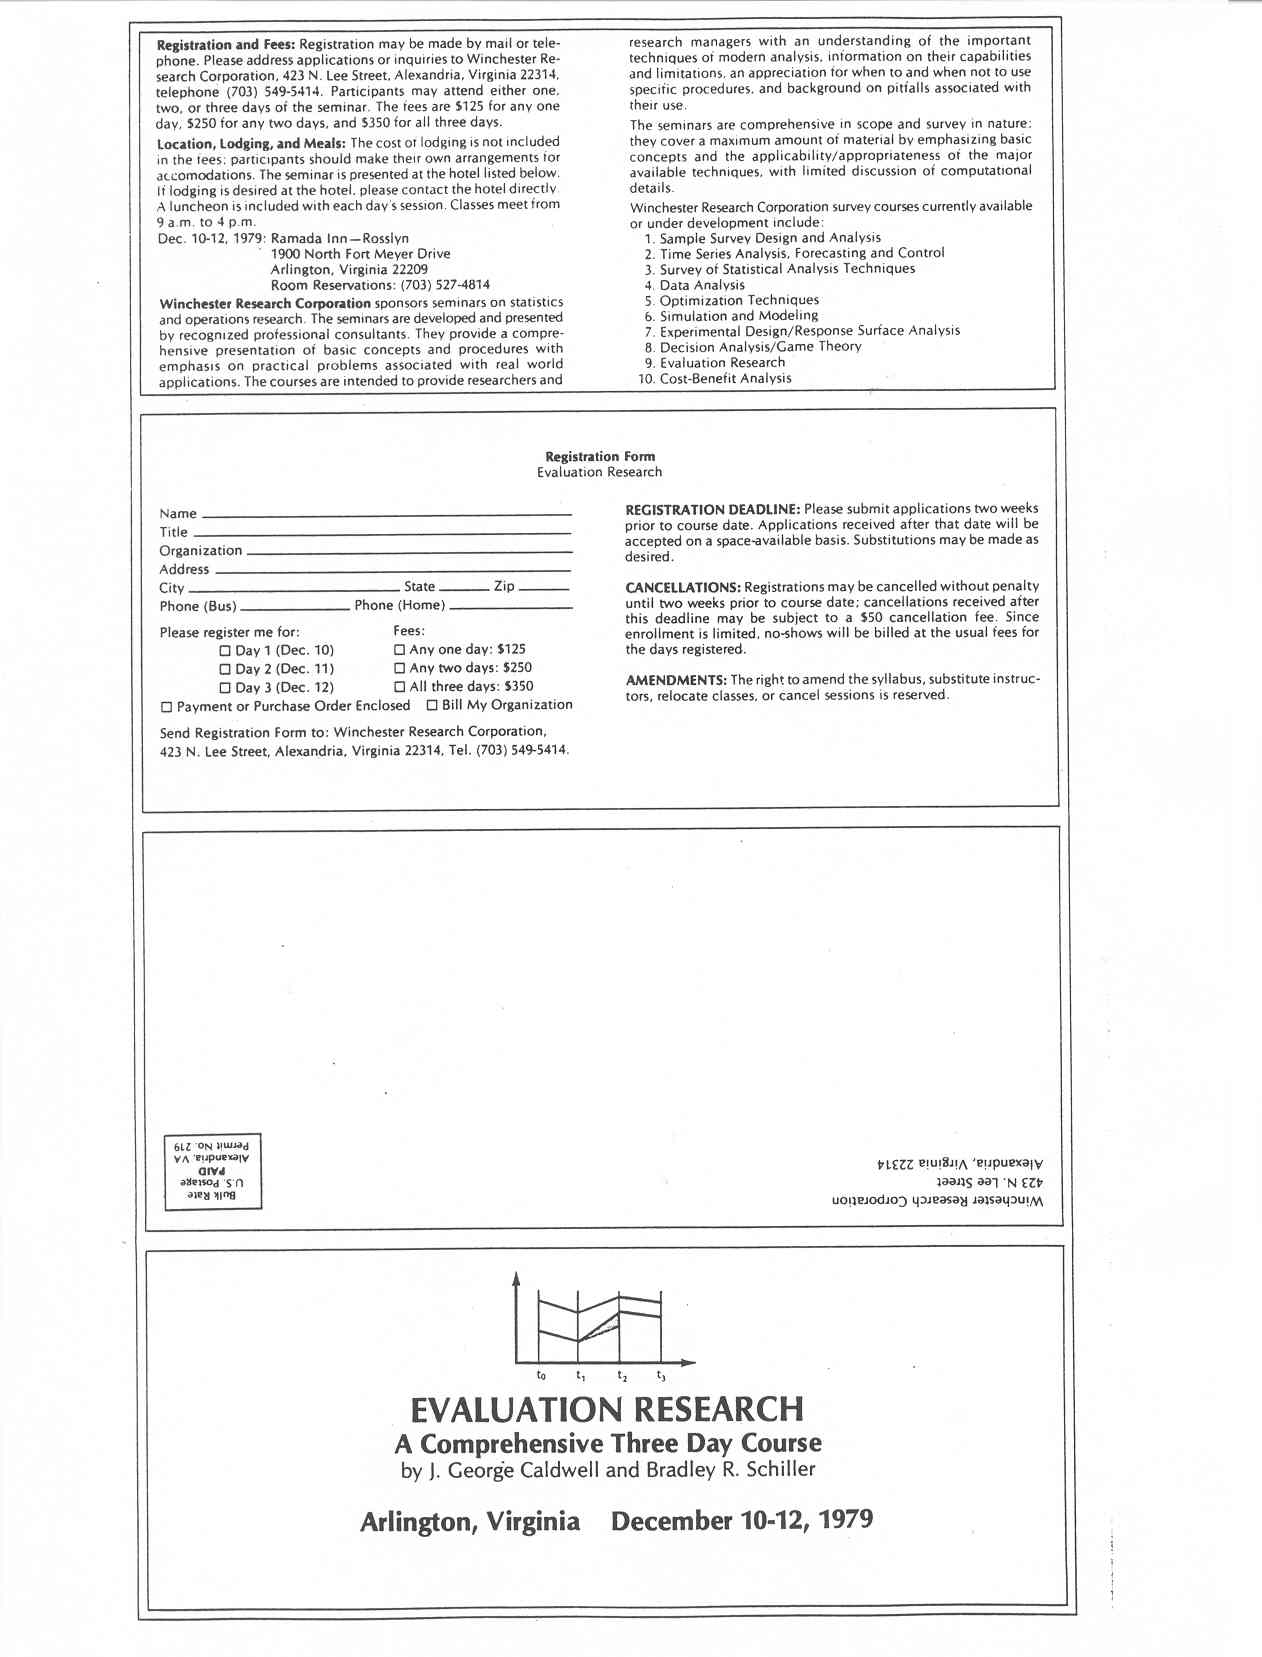
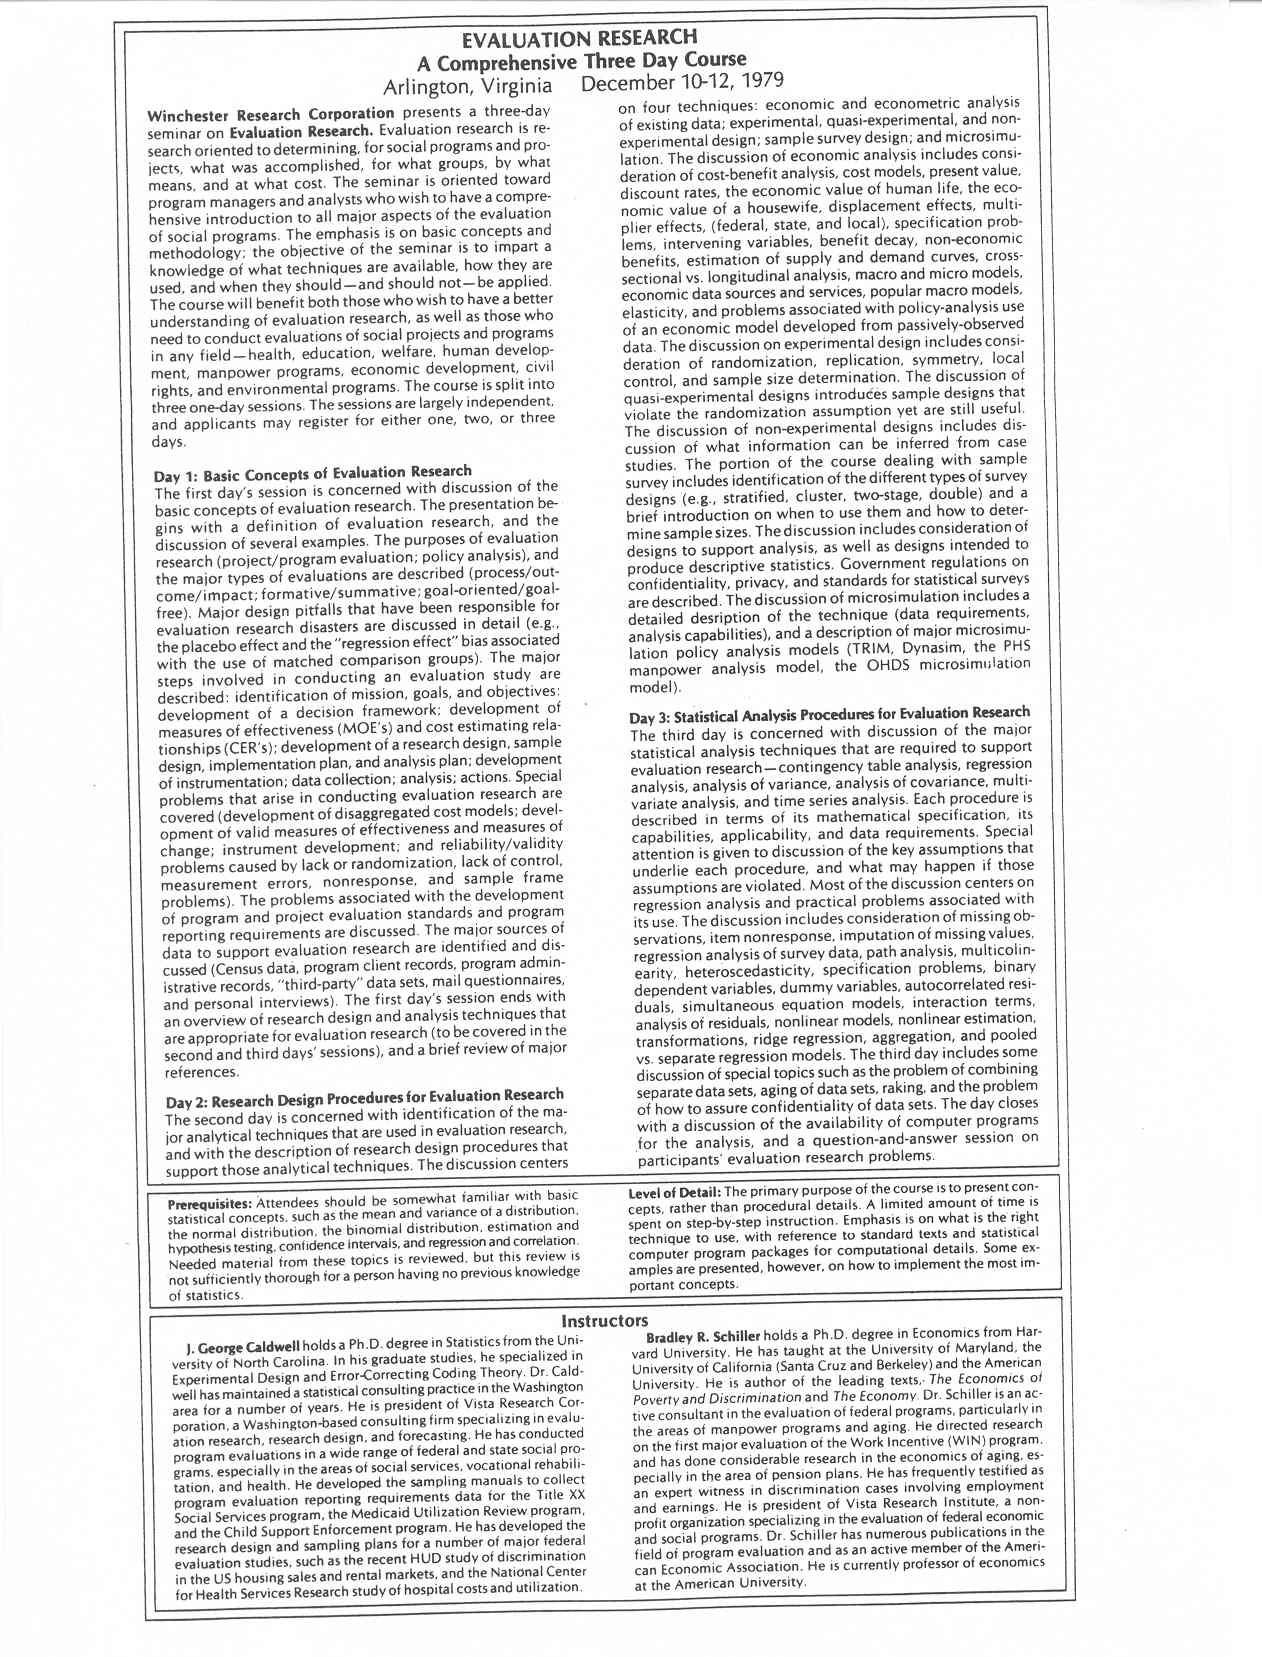
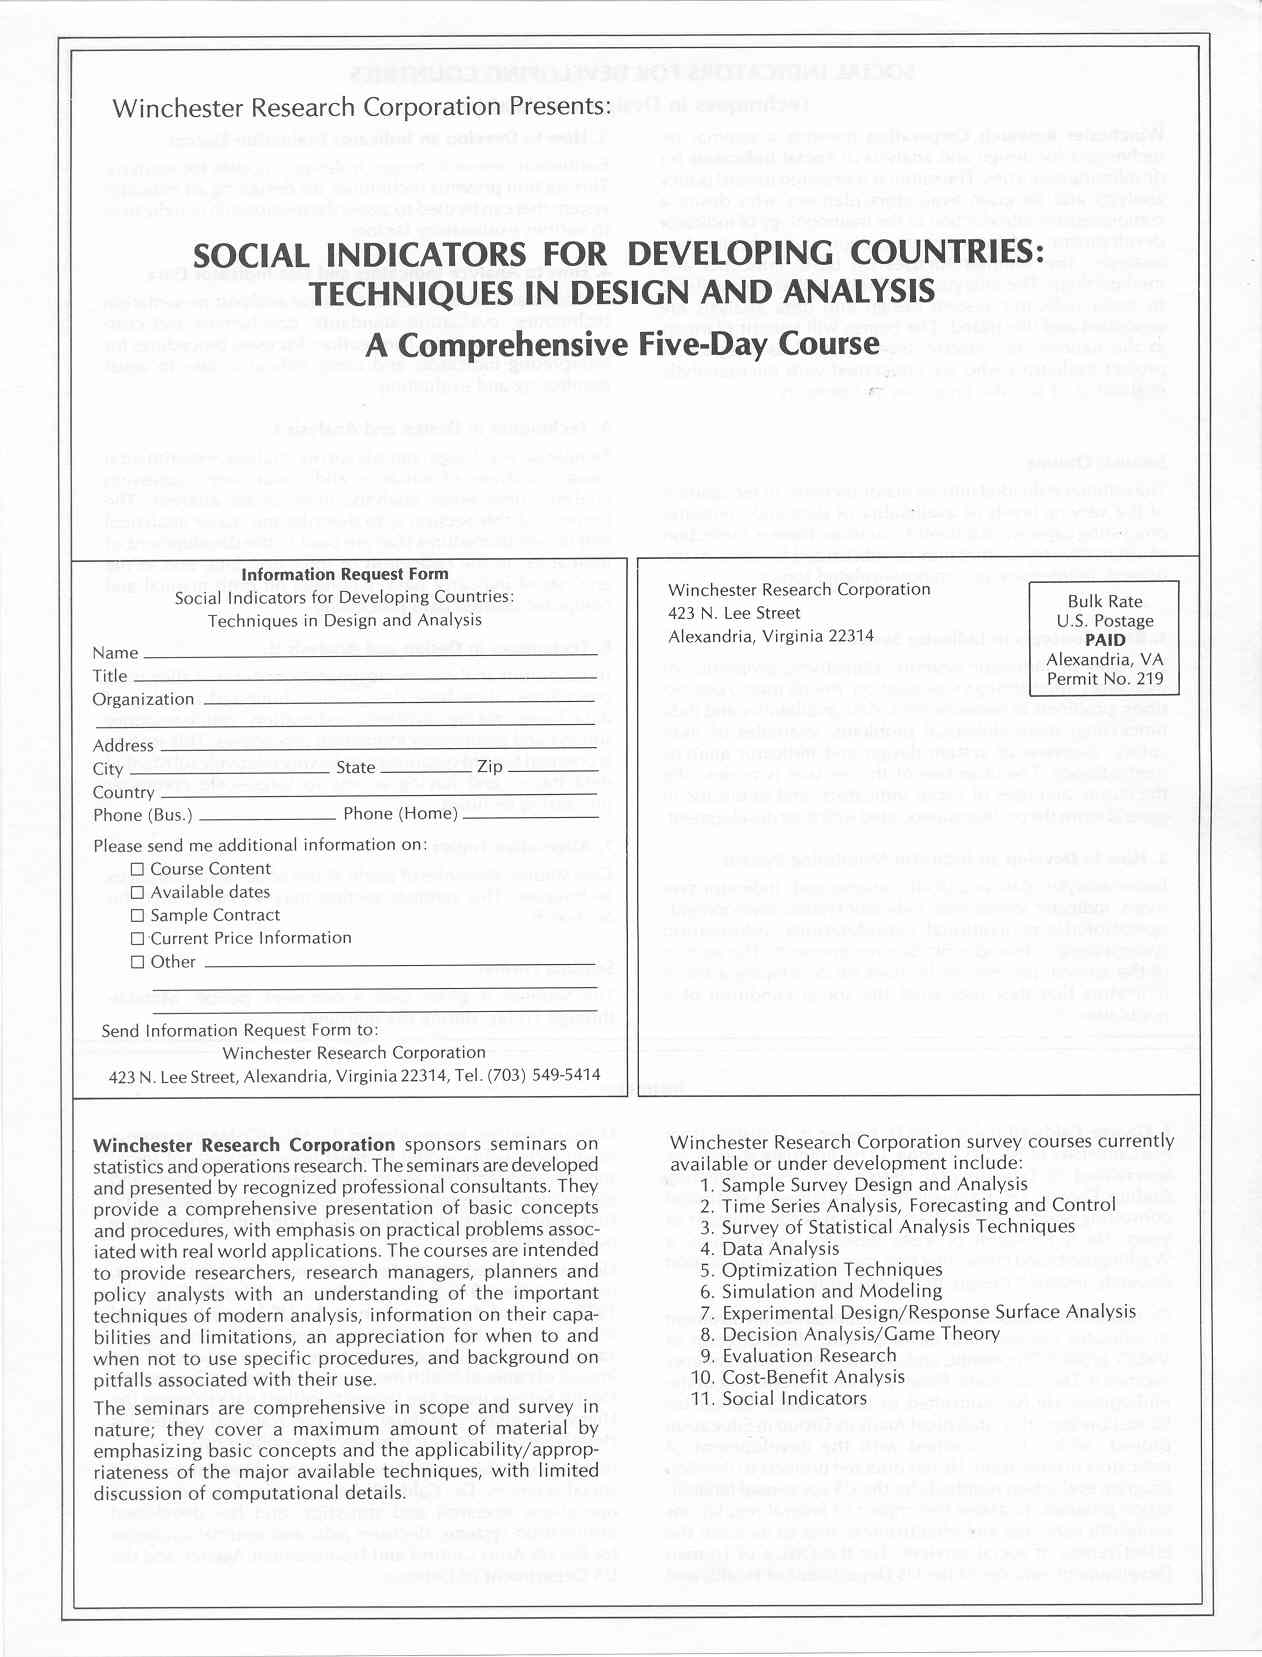
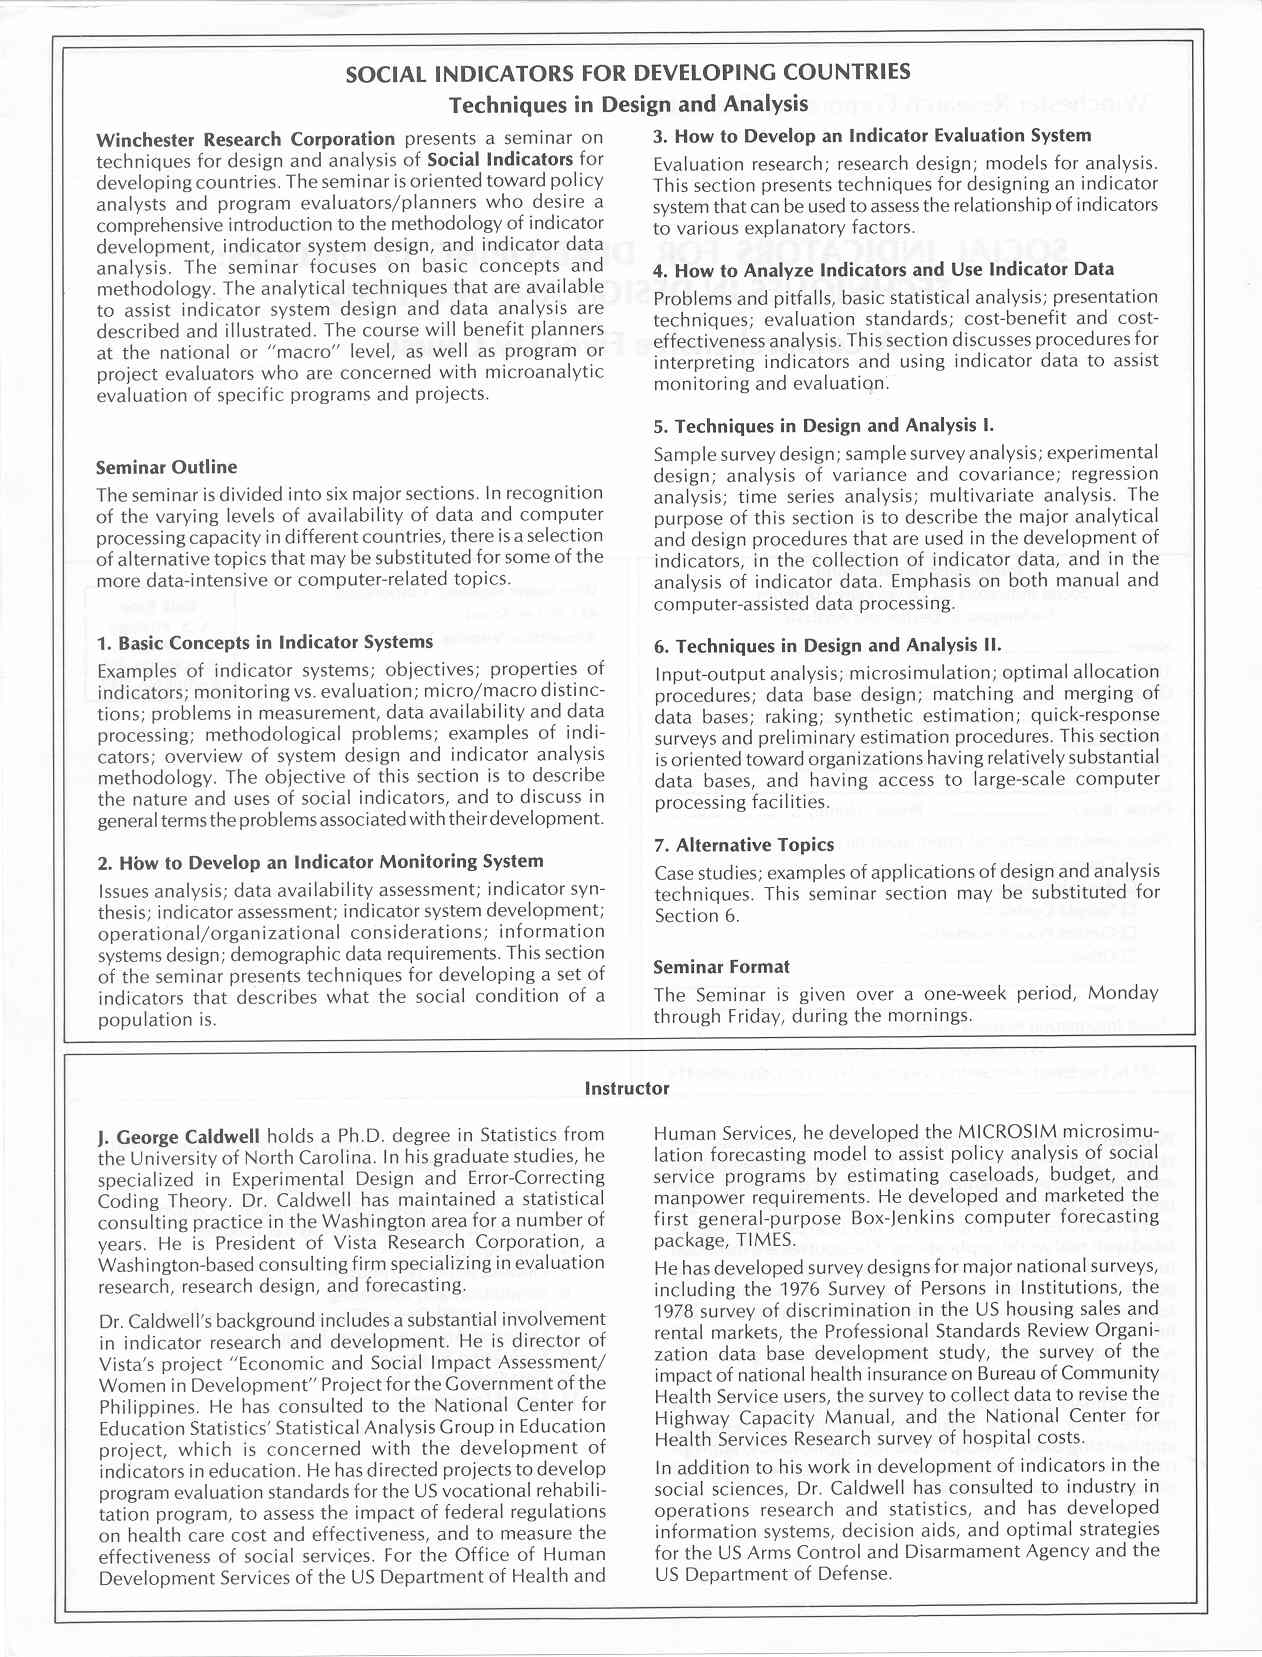
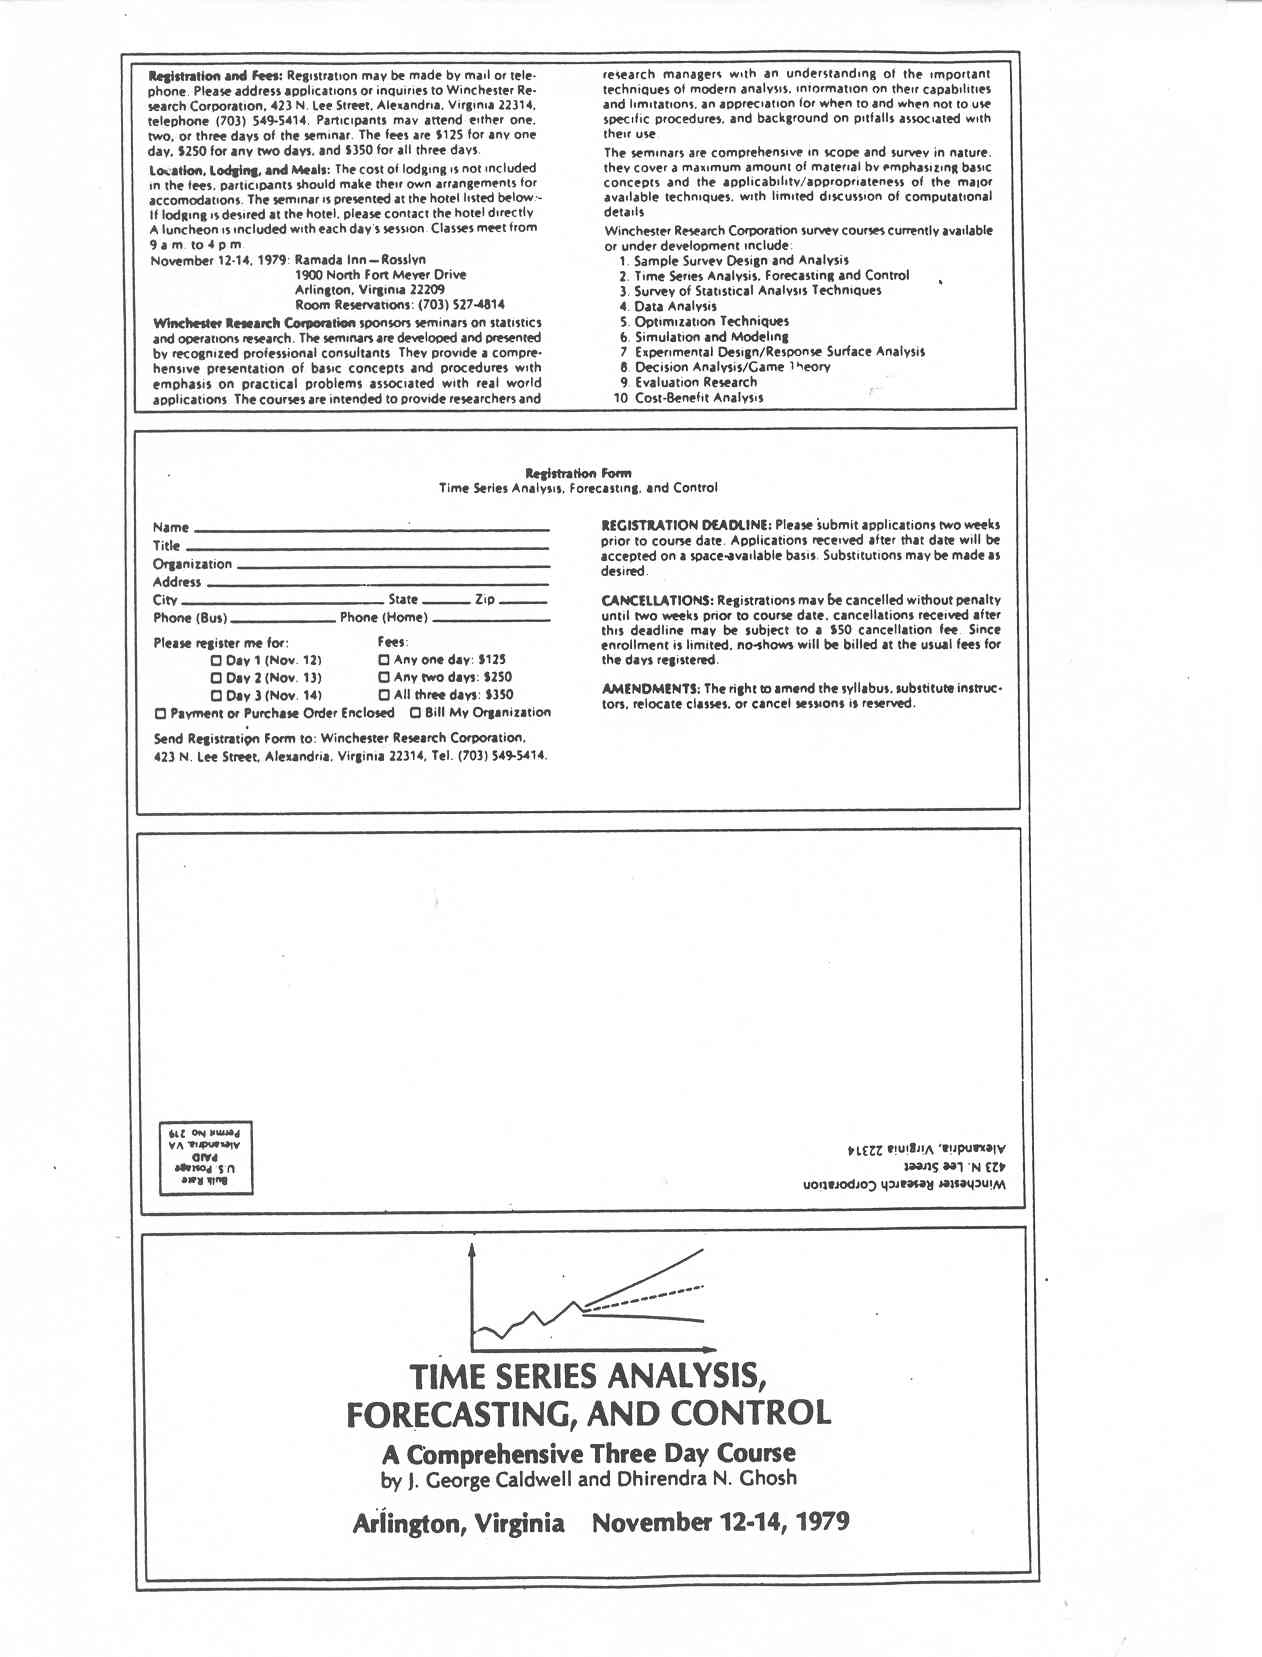
Miscellaneous Flyers. Here follow mailing flyers for a number of commercial short courses that were advertised, but not given because of insufficient enrollment. (3 April 2007.)
Data1 Data2 Data3 Data4 EvalRes1 EvalRes2 SocInd1 SocInd2 TimeSer1 TimeSer2
Computer program for determining sample size. This computer program estimates sample sizes for a variety of sample survey designs. The program contains descriptive information on how to use it. Sample sizes are determined for descriptive surveys based on analysis of the precision (standard errors) of estimates of interest (e.g., estimates of overall characteristics (totals, means, proportions) of a population or subpopulations of interest). Sample sizes are determined for analytical surveys based on statistical power analysis. (Posted 19 July 2007, updated 17 September 2013, 1 September 2020.)
For additional information on using statistical power analysis to determine sample size for analytical surveys, see the following article.
Determination of Sample Size for Analytical Surveys, Using a Pretest-Posttest-Comparison-Group Design This article describes how to estimate sample sizes for analytical sample surveys using statistical power analysis. It focuses on a standard survey design used for impact estimation, viz., the pretest-posttest-comparison-group design. (11 November 2016, updated 1 September 2020)